QEDBench:量化大学级数学证明自动化评估中的对齐鸿沟 QEDBENCH: Quantifying the Alignment Gap in Automated Evaluation of University-Level Mathematical Proofs
用272道大学级数学题、1300+份专家人工评分,系统审计LLM-as-a-Judge在证明评分中的系统性偏差与奉承陷阱。
前置知识
LLM-as-a-Judge
指用大语言模型作为评分员来评判其他模型输出的方法。给定一段生成内容和评分标准,judge模型输出一个分数或排名。QEDBench中部署了7个前沿模型(GPT-5.2 Pro、Claude Opus 4.5、Gemini 3.0 Pro、Grok 4、Qwen 2.5 Max、DeepSeek-V3、Llama 4 Maverick)对1300+份证明进行评分。
本文的核心问题就是审计这种自动评分方法在大学级数学证明场景下与人类专家判断的对齐程度,因此必须先理解这一范式的工作流程和它在简单任务上的成功历史。
Alignment Gap(对齐鸿沟)
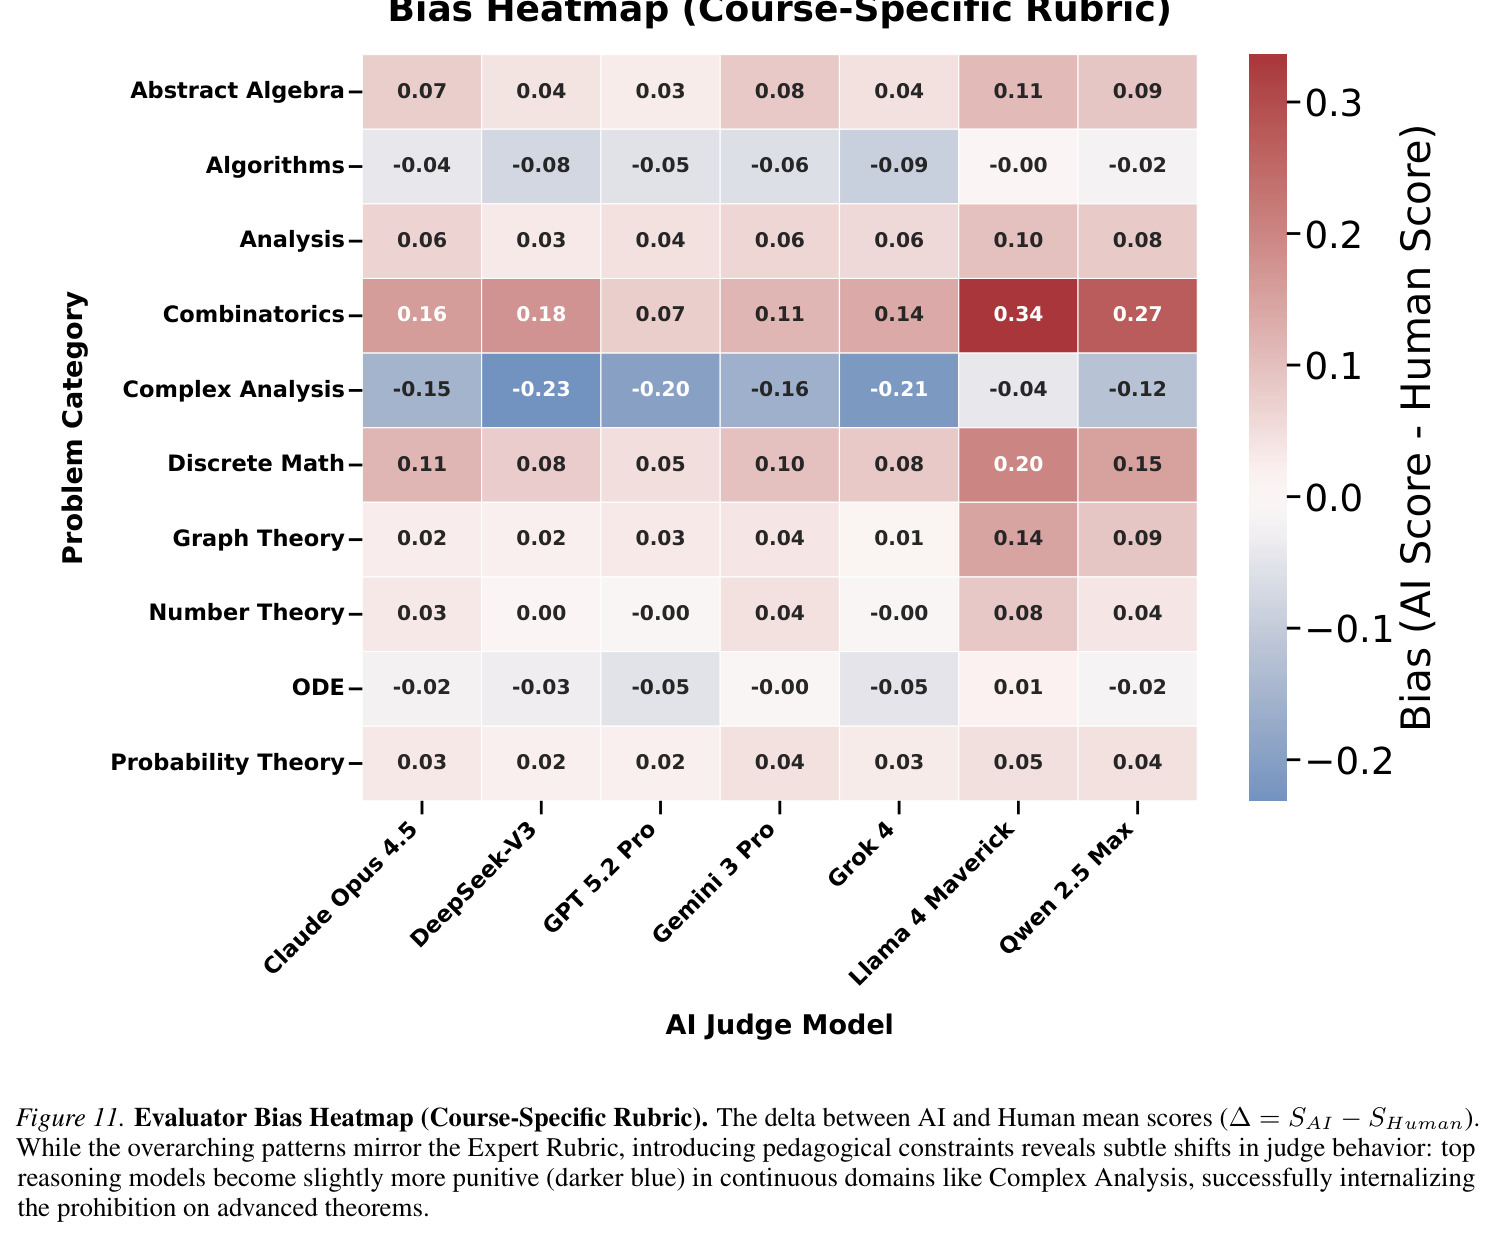
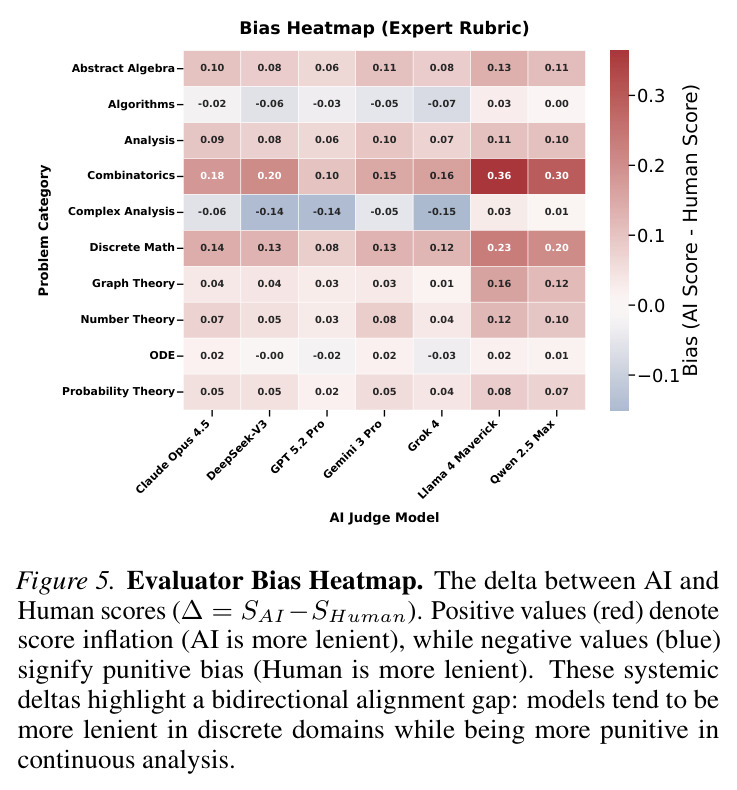
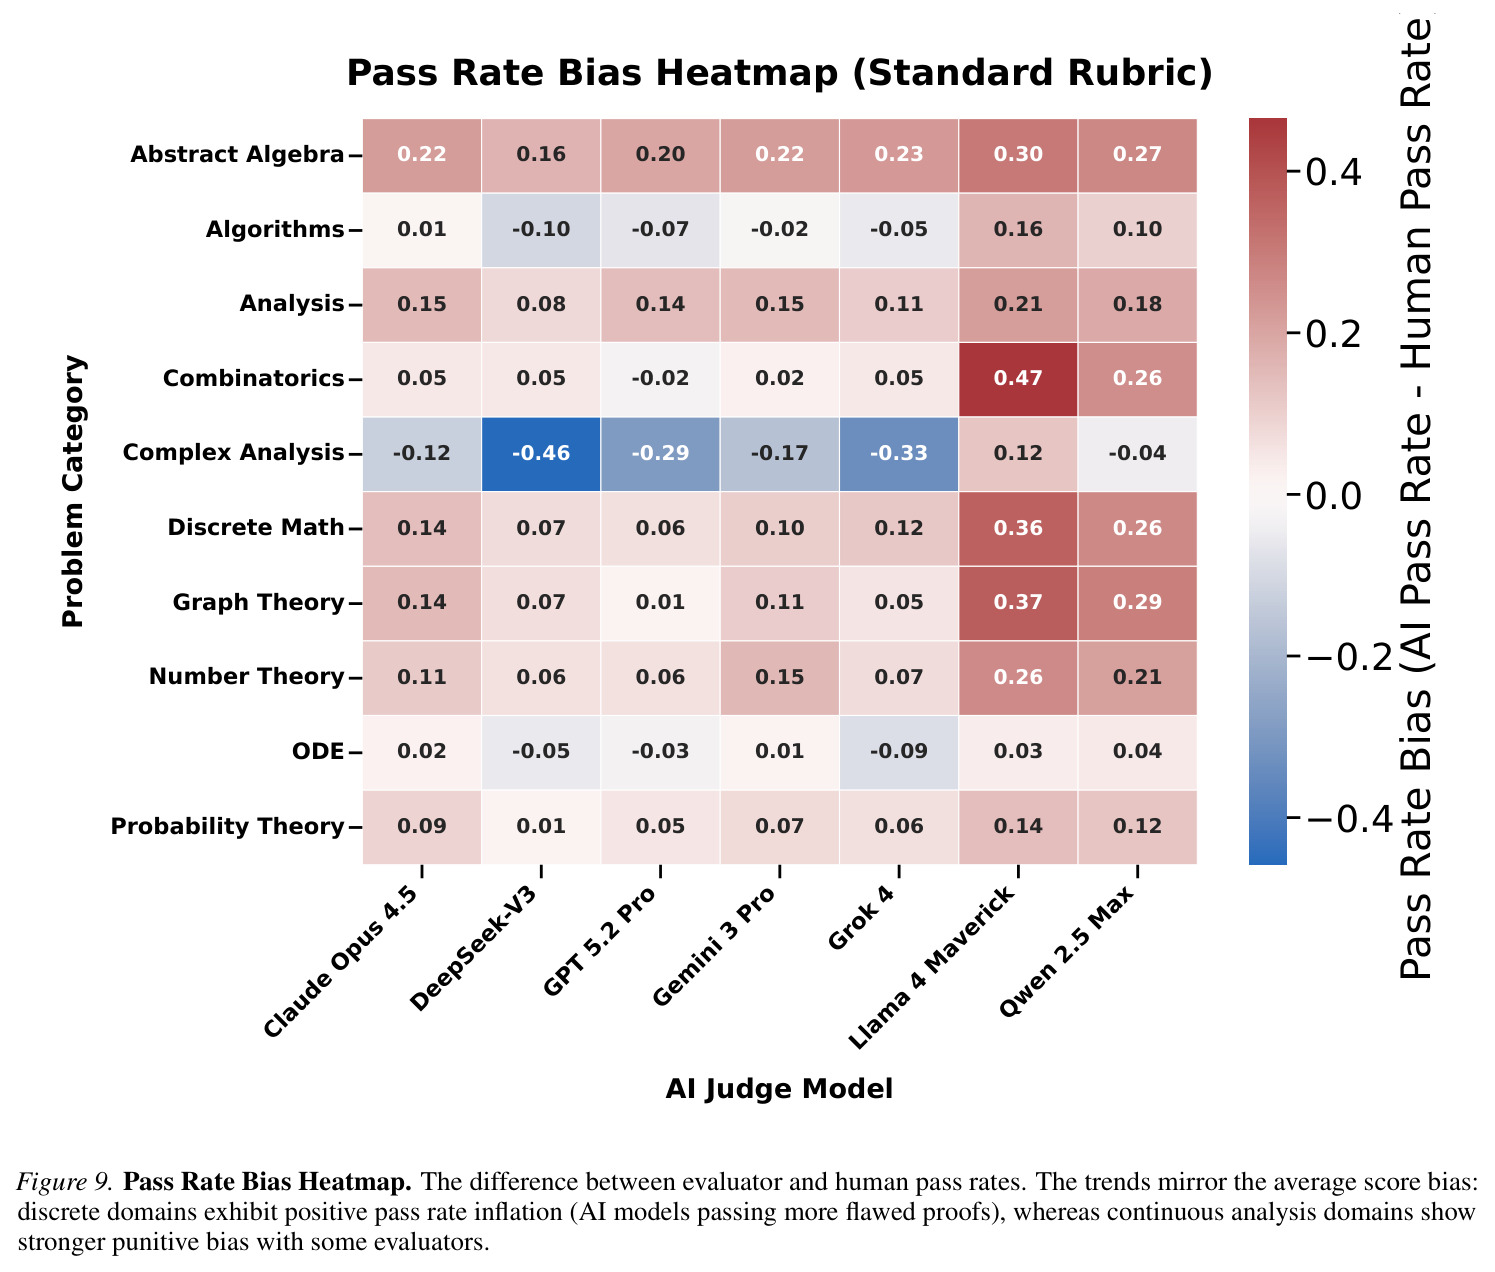
本文定义的关键度量:AI评分$S_{AI}$与人类专家评分$S_{Human}$之间的差值$\Delta = S_{AI} - S_{Human}$。正$\Delta$代表AI宽松(grade inflation),负$\Delta$代表AI严苛。本文发现这一鸿沟在数学子领域上呈双向分布——离散数学中AI显著宽松,Complex Analysis中AI反而更严苛。
这是论文量化LLM评估缺陷的核心度量,没有这个概念就无法理解QEDBench的方法论和实验结论。
Dual-Rubric双评分准则
QEDBench设计的两种评分标准:Course-Specific Rubric(教学标准,要求严格遵循本科定义、不得使用高级定理)和Expert Rubric(专家标准,要求逻辑正确,允许调用通用领域知识)。同一道证明分别用两套标准打分,从而分离表层合规和逻辑严密两个轴。
这是论文的核心方法论创新——通过双准则区分LLM评分时究竟在奖励排版/步骤完整性,还是在真正判断数学正确性。
离散-连续推理鸿沟
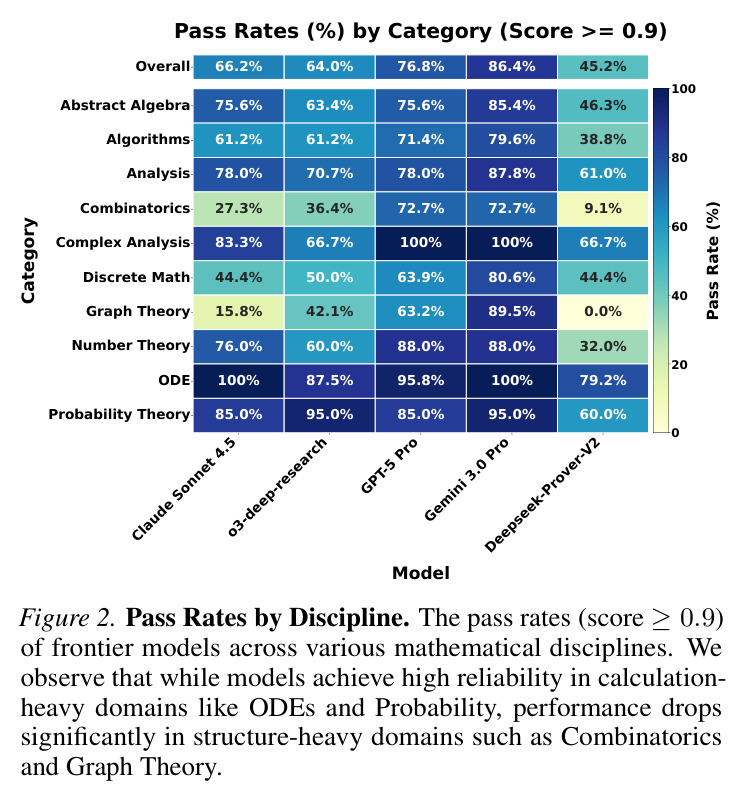
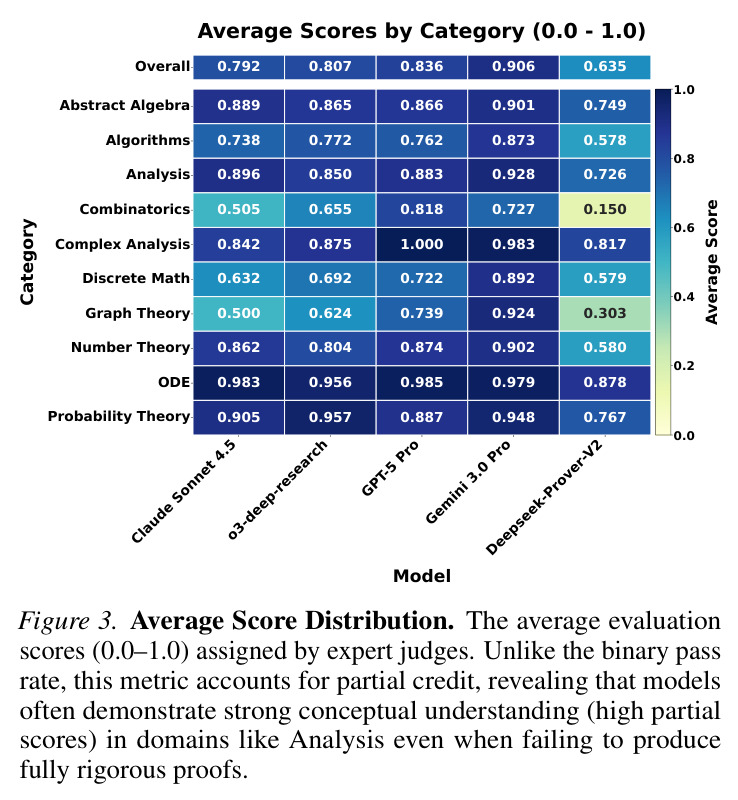
本文发现的模型在两类数学域上的表现分裂:在ODEs、Complex Analysis等程序化域(套公式即可)上接近饱和(100%通过率),但在Combinatorics、Graph Theory等需要构造性搜索的离散域上崩溃(通过率<30%)。QEDBench实测Claude Sonnet 4.5在ODE 100%通过,在组合数学仅27.3%。
该现象说明当前模型所谓的推理是模板检索而非通用搜索能力,是QEDBench最重要的实证发现之一。
研究动机
随着LLM在高小级数学竞赛(如GSM8K、MATH)上趋于饱和,评测瓶颈从能否生成答案转向能否可靠评分。但大学级数学证明(高年级本科到初级研究生)的自动评估存在一个根本性矛盾:基于Lean等自动形式化验证框架的方案虽能保证正确性,但标注成本极高、题目规模受限;反之LLM-as-a-Judge范式可扩展但与专家判断相关性差。最新研究(如Mahdavi等2025)表明LLM评分员倾向于根据权威感、写作风格而非逻辑严密性来给分,会奖励看似严谨实则伪造的伪证。例如GPT-5.2 Pro曾给一段仅含API错误消息的输出打0.5分。这使得在实际部署中根本无法区分真正的逻辑推理和幻觉式精确,亟需一个量化对齐程度的标准化基准。
本文的目标是QEDBench旨在构建一个大规模、严格、面向大学级数学证明的双评分准则对齐基准。具体目标包括:(1) 收集272道高年级本科/初级研究生难度的证明题,覆盖Analysis、Complex Analysis、Abstract Algebra、Discrete Math、Graph Theory等10个核心学科;(2) 用PhD级专家耗时1000+小时人工评分,确立可重复的ground truth;(3) 部署7个前沿模型作为评分员,5个模型作为解题员,构建7×5评估矩阵;(4) 量化自动评分与人工评分之间的系统性偏差,揭示当前LLM评估范式的失败模式。
与已有工作不同的是,与现有benchmark(如ProofBench、FrontierMath、U-MATH、IMProofBench)相比,QEDBench独特定位于高年级本科到初级研究生的中间地带——比奥数题难但比研究级题目易验证。它首次明确解耦了解题能力与评分能力两个轴,并用双准则方案(Course-Specific vs Expert)区分表层合规和逻辑严密;最关键的是它把研究对象从模型在数学题上得多少分转向模型评分员对证明的真实判断准确率,这是过去的工作要么隐式假设、要么没有充分审计过的角度。
核心方法
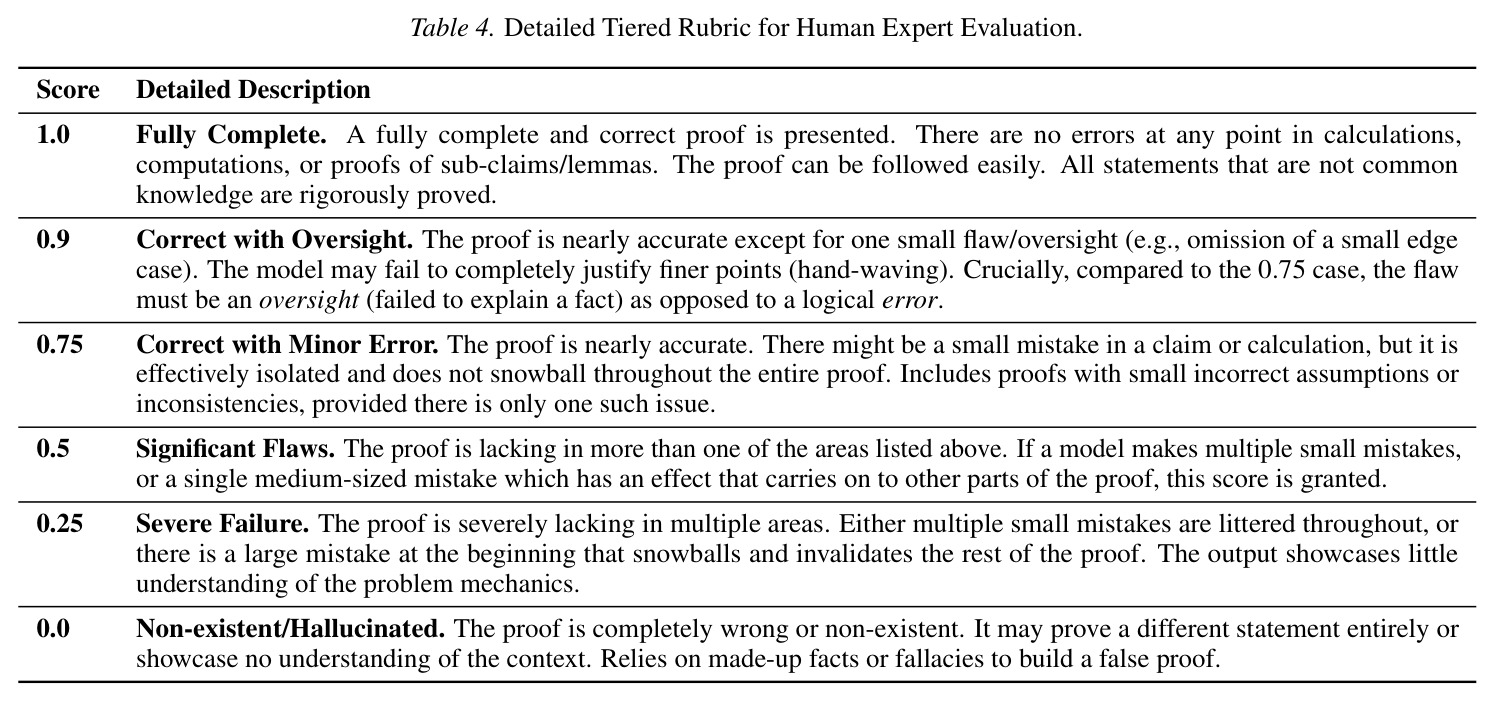
QEDBench采用三阶段流水线构建数据集与评测体系。直觉上:先让多个最强解题模型独立产出证明,再让人类专家对每份证明按细粒度6档评分尺(0, 0.25, 0.5, 0.75, 0.9, 1.0)打分,最后让多个LLM评分员按两种不同准则重打同一批证明,通过对比自动评分与人类评分得到对齐鸿沟。技术上,第一阶段用5个前沿解题模型(o3-deep-research、GPT-5 Pro、Claude Sonnet 4.5、Gemini 3.0 Pro、DeepSeek-Prover-V2)在每题最高16384 token、2000秒超时下生成LaTeX证明,失败重试3次后默认0分;第二阶段由48位PhD级专家按题匹配专业领域后进行人工评分并迭代修改评分准则;第三阶段用7个LLM评分员(GPT-5.2 Pro、Claude Opus 4.5、Gemini 3.0 Pro、Grok 4、Qwen 2.5 Max、DeepSeek-V3、Llama 4 Maverick)以Course-Specific和Expert两套准则分别独立打分,得到7×5交叉矩阵。
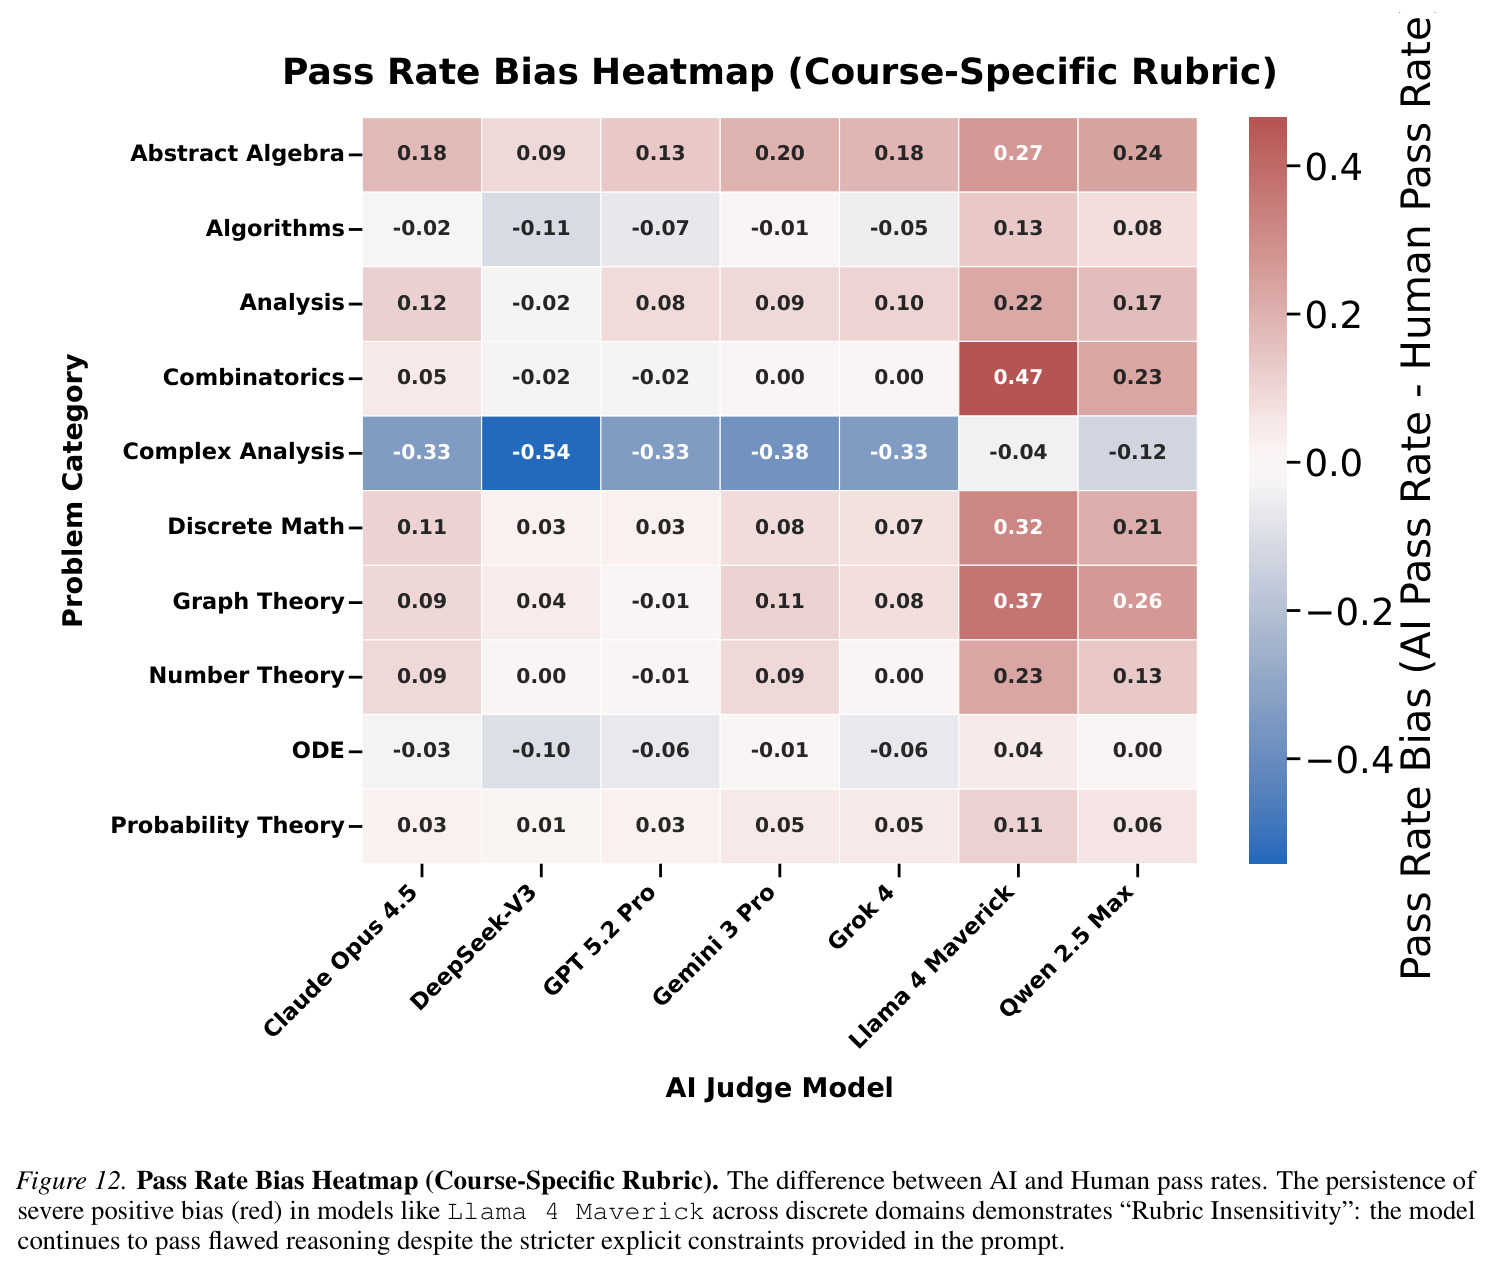
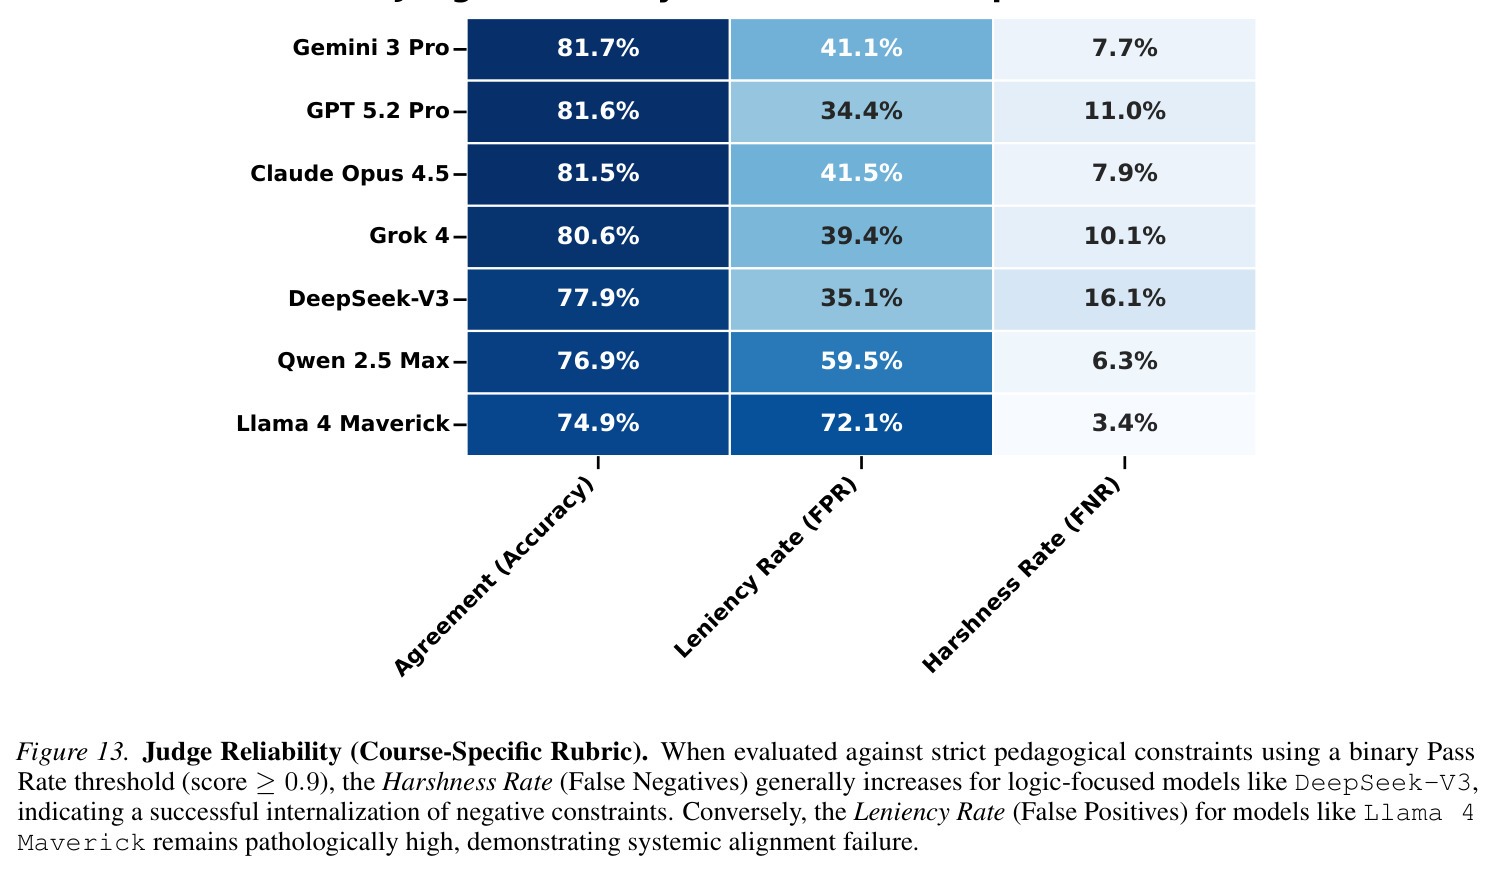
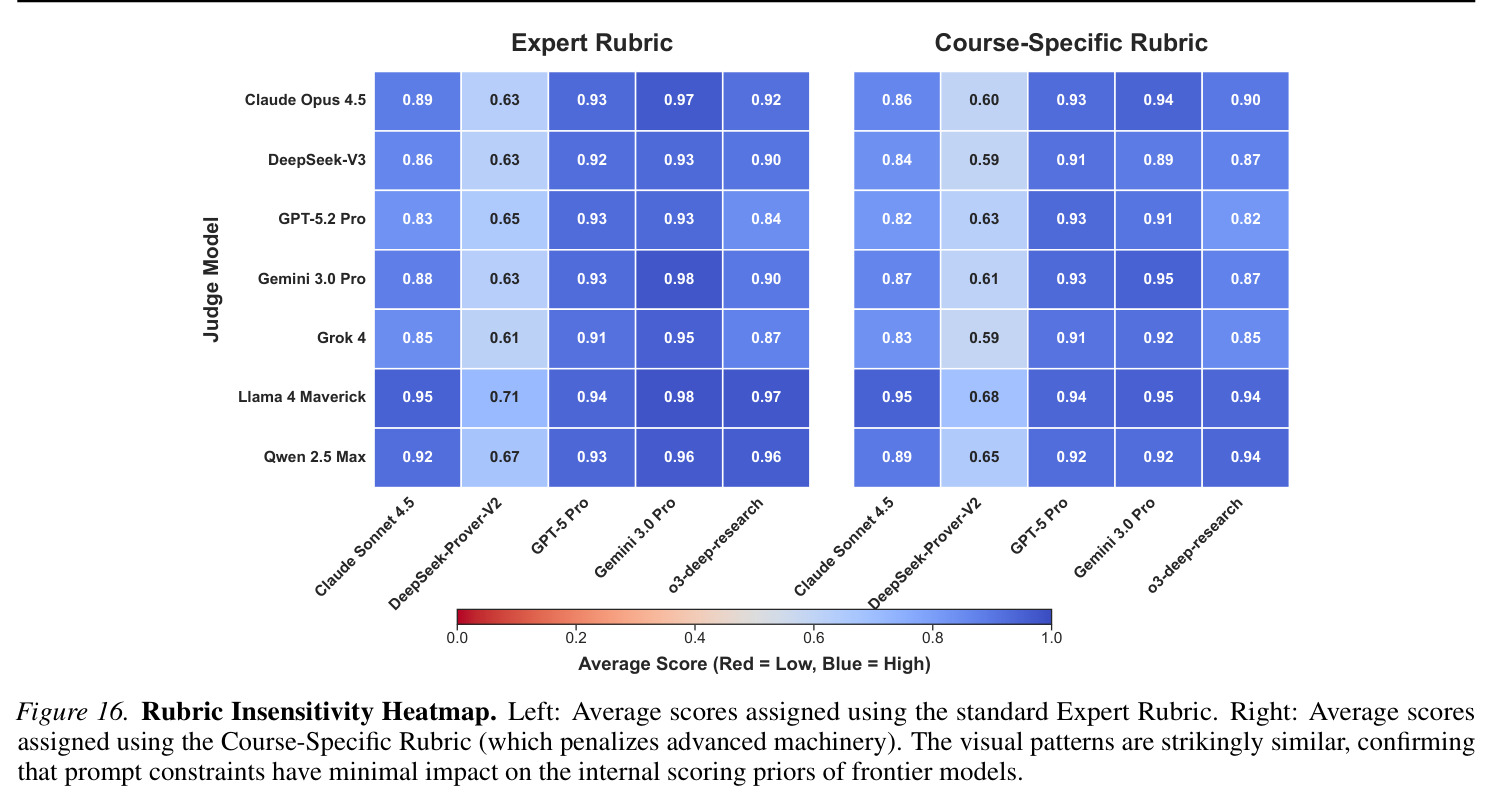
核心创新在于Dual-Rubric对齐度量:通过在同一份证明上同时施加两套不同严格度的评分准则,量化LLM评分员的内部偏置。具体而言,Course-Specific Rubric要求严格遵循本科定义、禁止调用高级定理;Expert Rubric允许使用通用领域知识但要求逻辑严密。当两套准则下AI评分差距很小时,意味着AI评分对约束不敏感(Rubric Insensitivity);当AI评分与人工评分差距很大时,意味着存在系统性偏差。配合Failure Mode Decomposition(将错误拆分为Leniency Rate假阳性率和Harshness Rate假阴性率),本文首次给出了LLM数学评分员同意偏向(Agreeableness Bias)的定量证据。
方法步骤详情
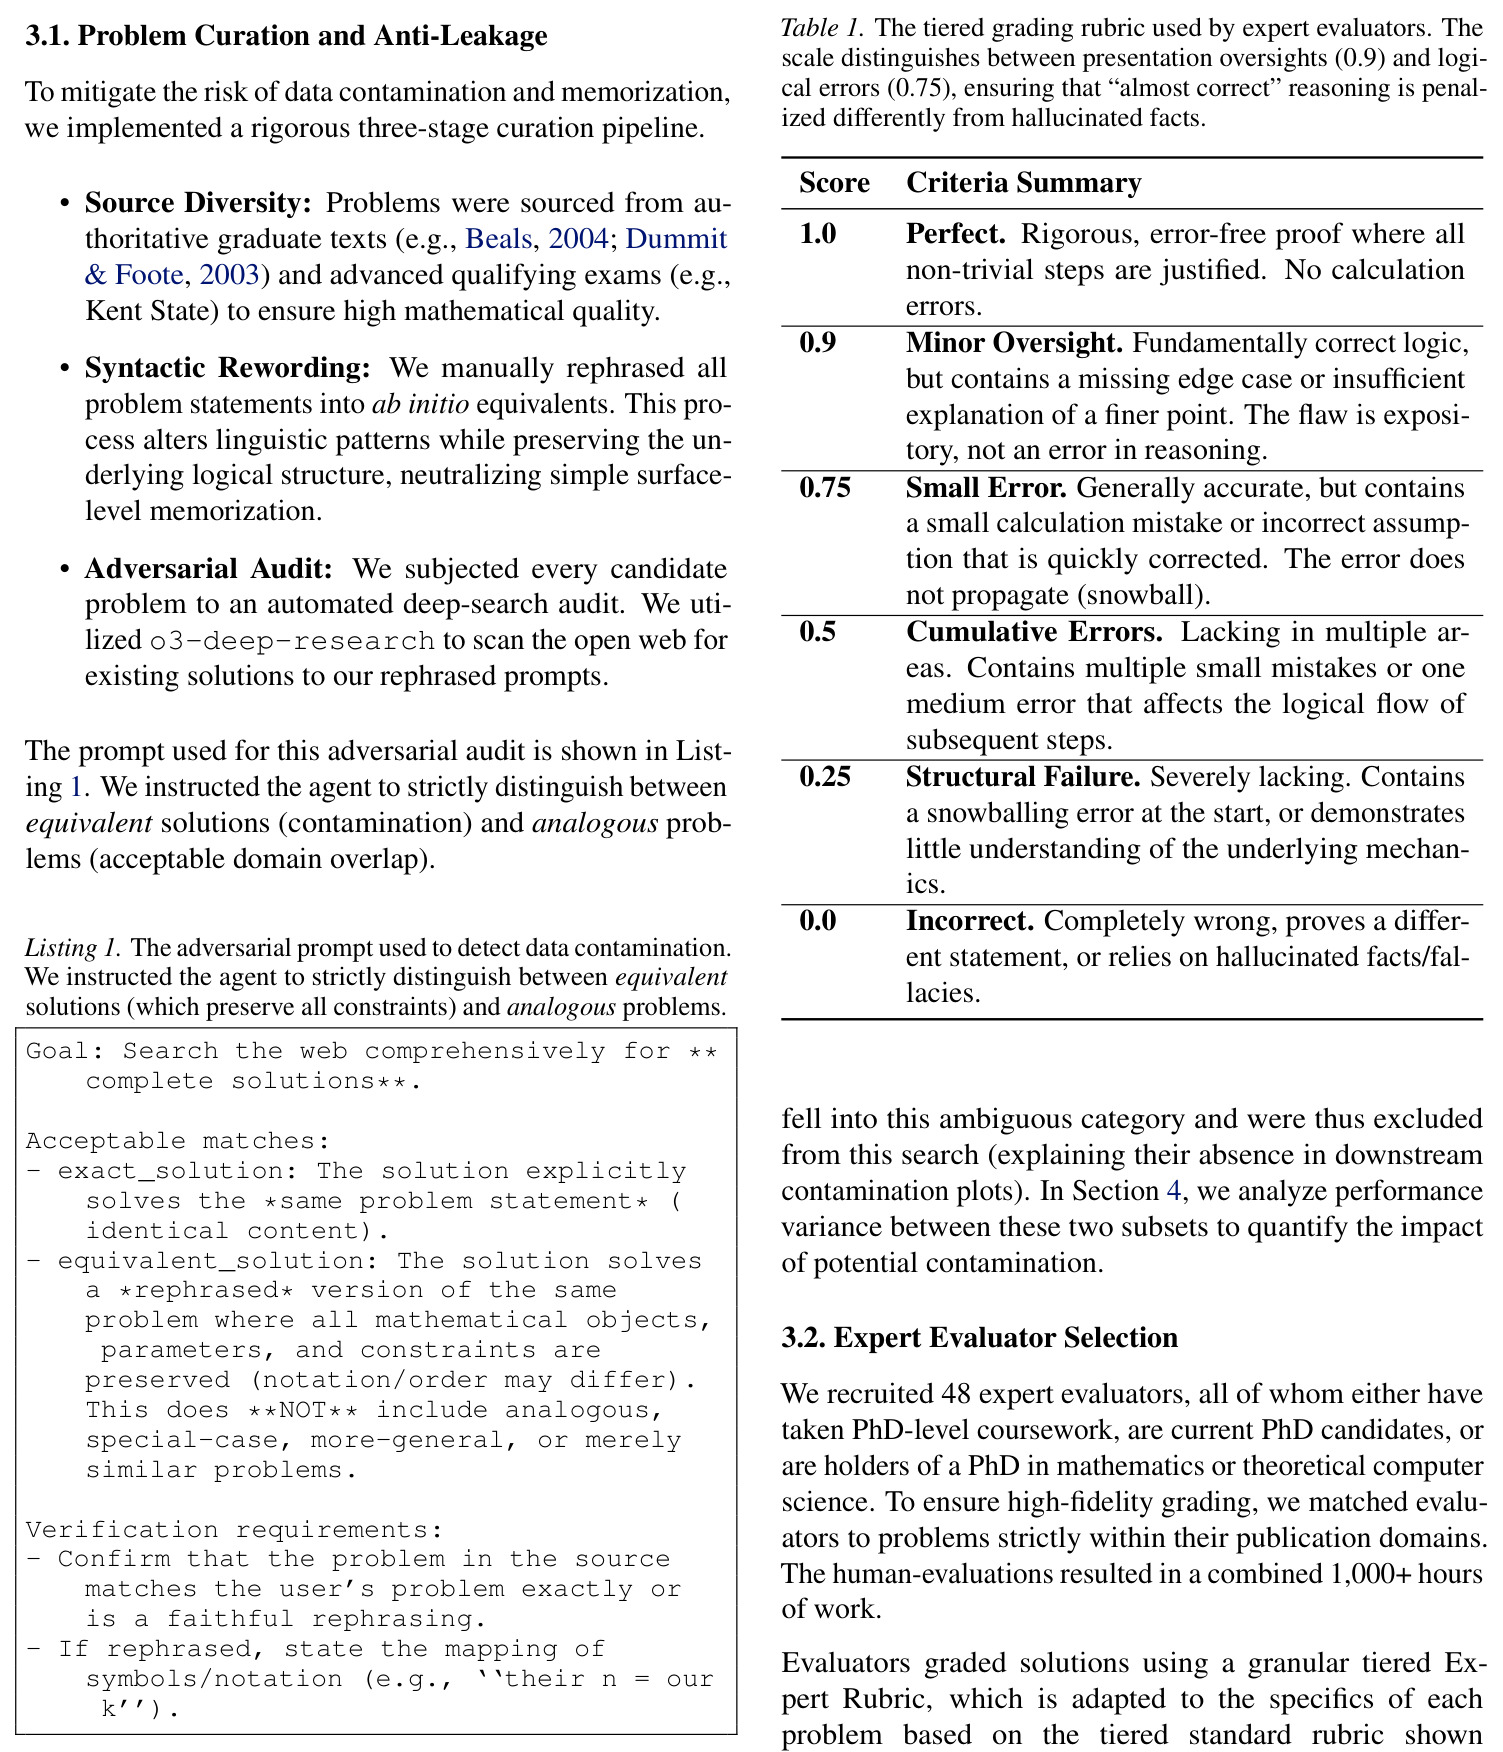
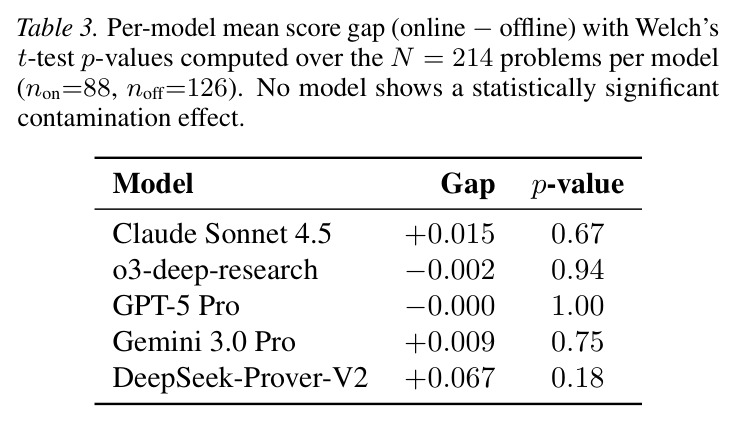
完整流程为:(1) 题目策展——从Beals、Dummit & Foote、Diestel等权威教材及Kent State等资格考试中精选272题,手动重写为ab initio等价形式以反记忆化,再用o3-deep-research做反污染扫描(272题中88题有在线解、126题无解、58题模糊剔除);(2) 解题生成——5个模型各产出一份LaTeX证明,共1300+份;(3) 专家评分——48位PhD级专家按6档细粒度评分尺(区分0.9表述疏忽vs 0.75小错、0.5累积错误vs 0.25结构性失败)打分并标注文本,同时专家迭代修改GPT-5.2 Pro和Gemini 3.0 Pro生成的初始准则,使其与自身判断对齐;(4) AI评分——7个模型对全部1300+份证明分别用两种准则打6档分(强制JSON输出以隔离分数与后验解释);(5) 对齐分析——计算$\Delta = S_{AI} - S_{Human}$、Pearson相关系数、Leniency Rate(人类判不及格但AI判及格的比例)和Harshness Rate(人类判及格但AI判不及格的比例);(6) 反污染检验——用Welch t检验和Mann-Whitney U检验对比有/无在线解的题目表现,验证未受污染。
技术新颖性
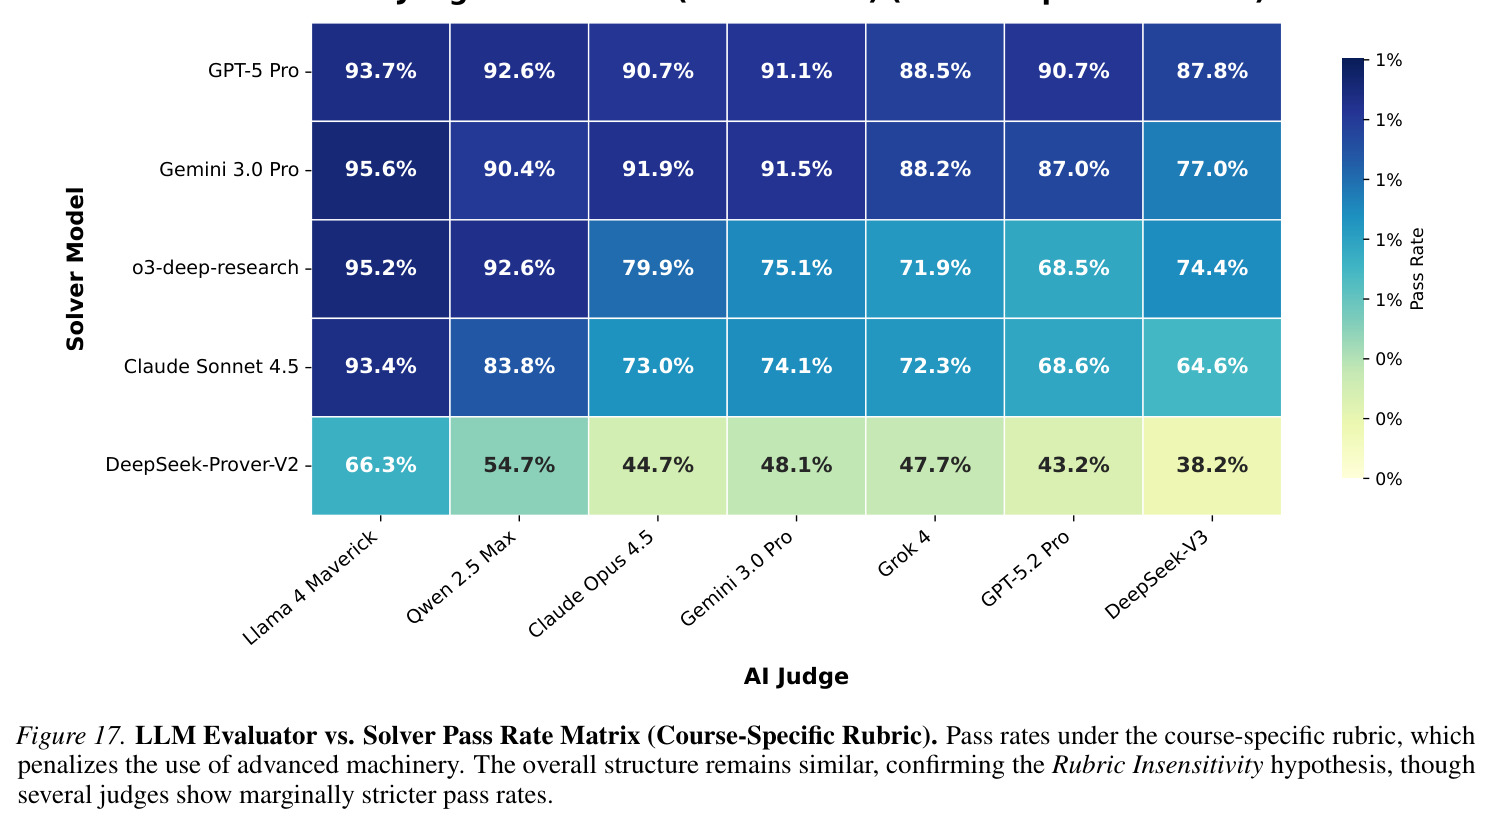
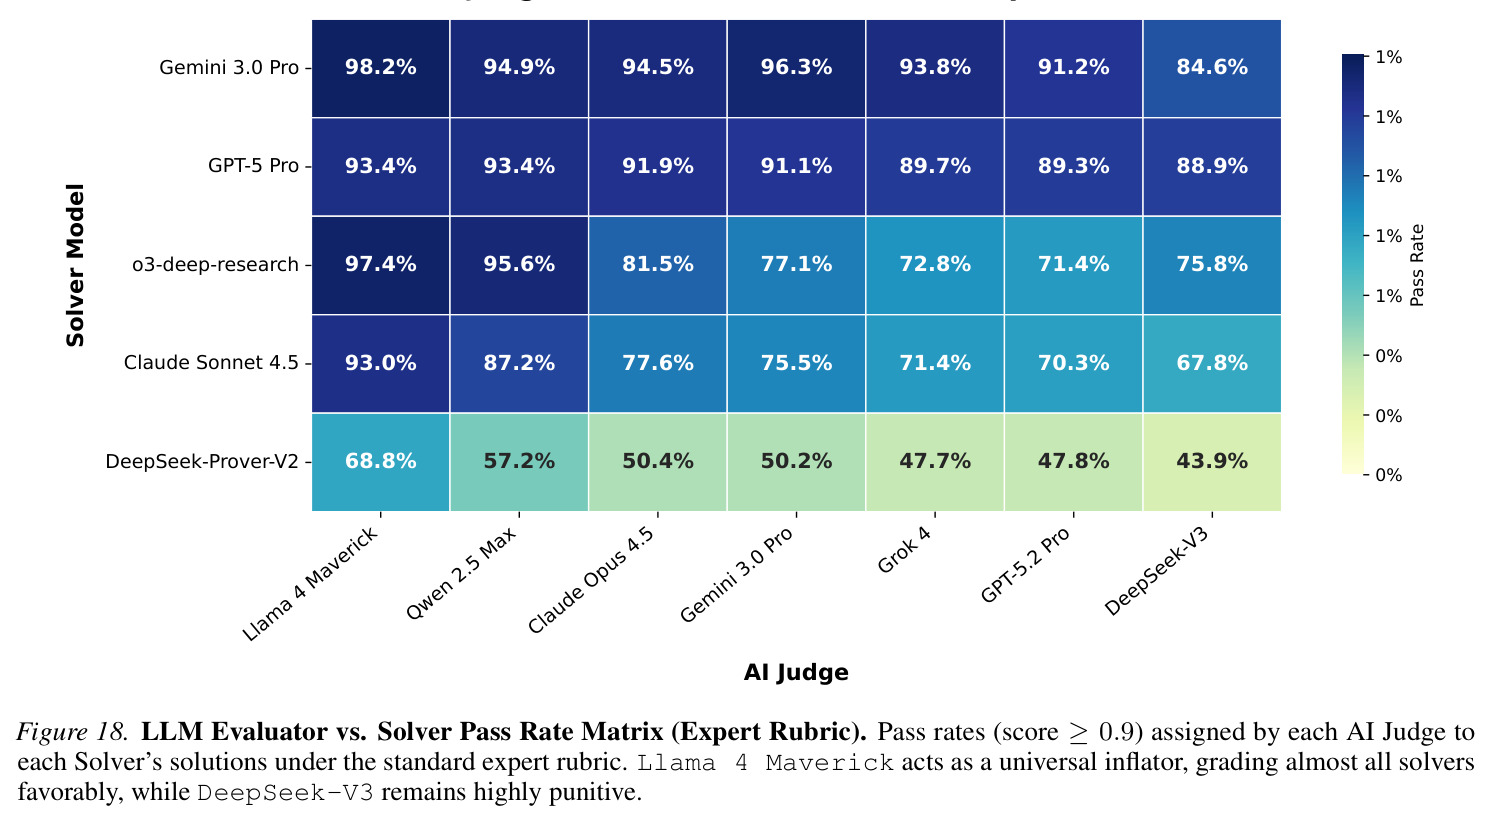
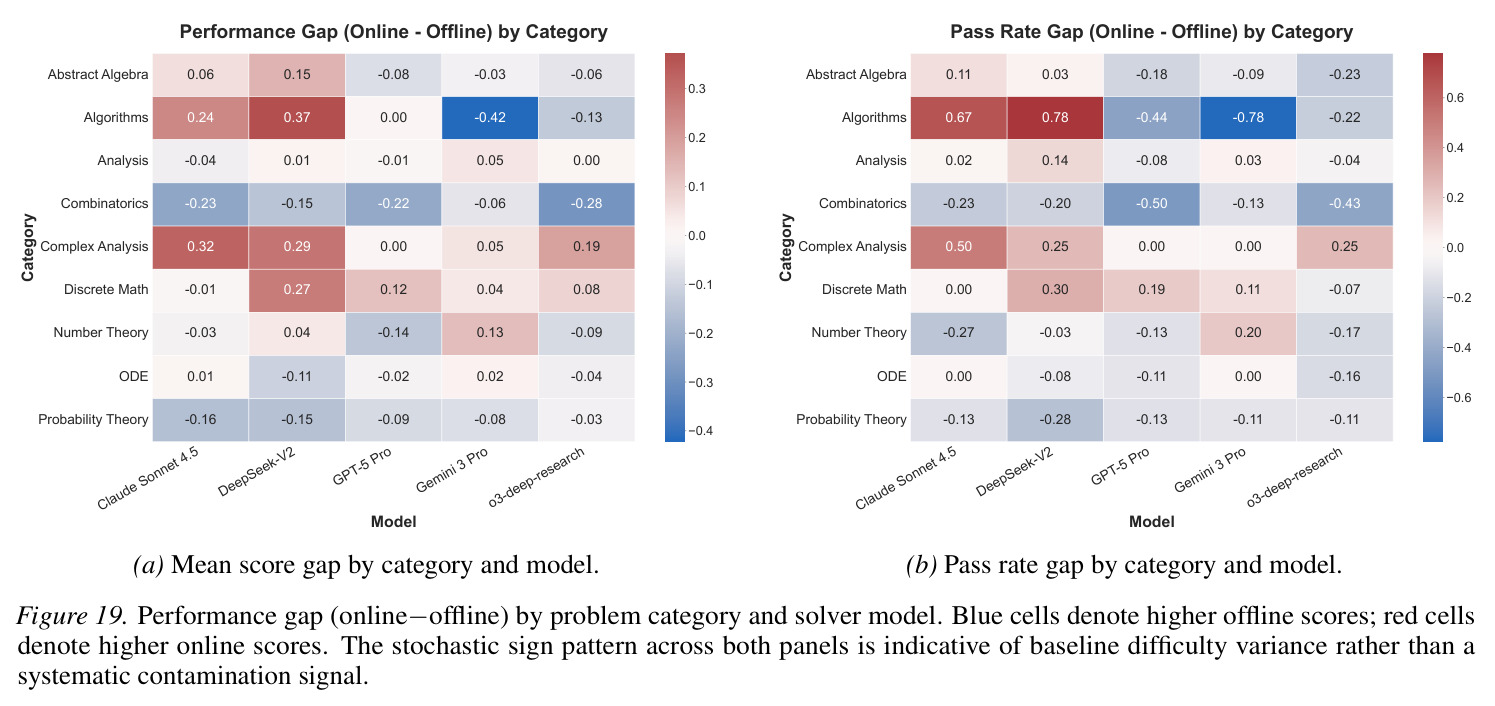
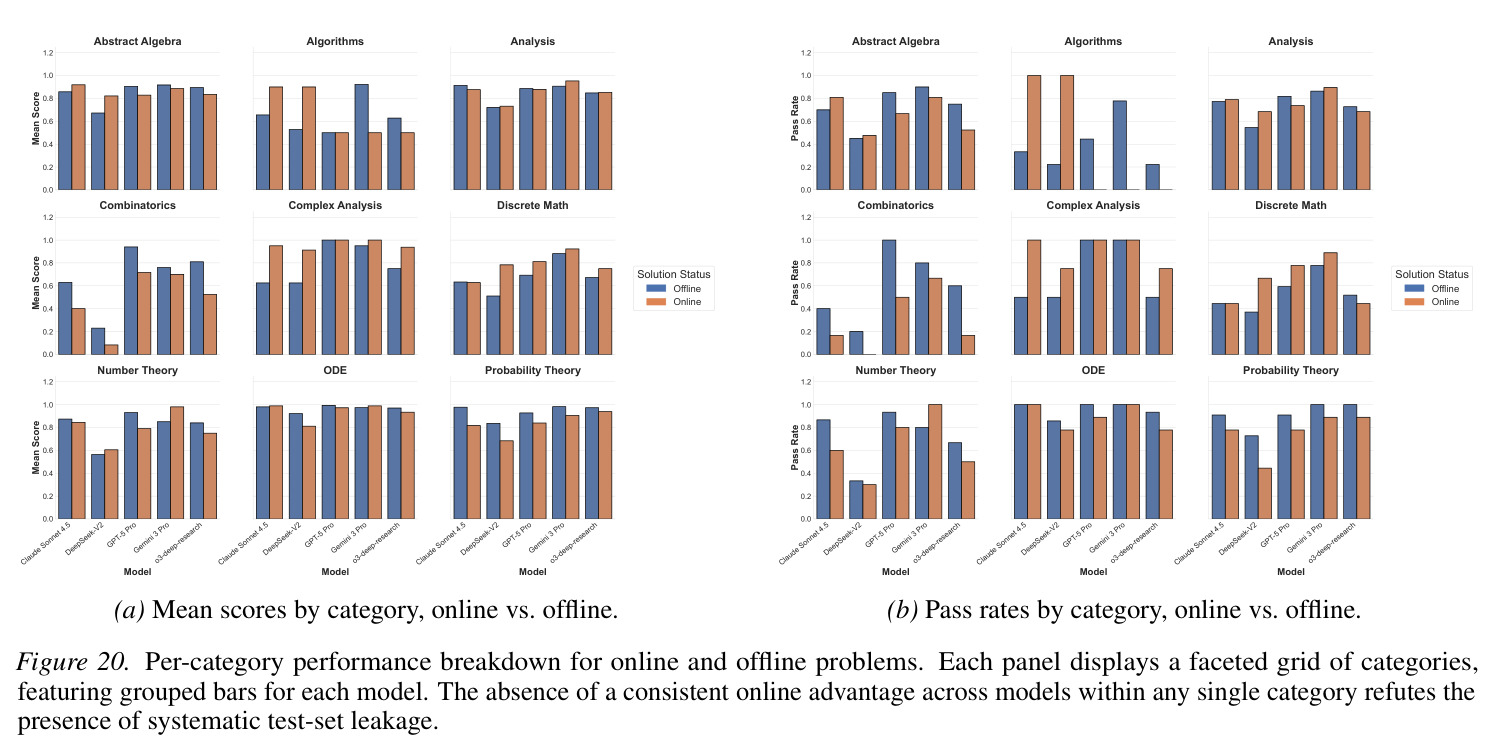
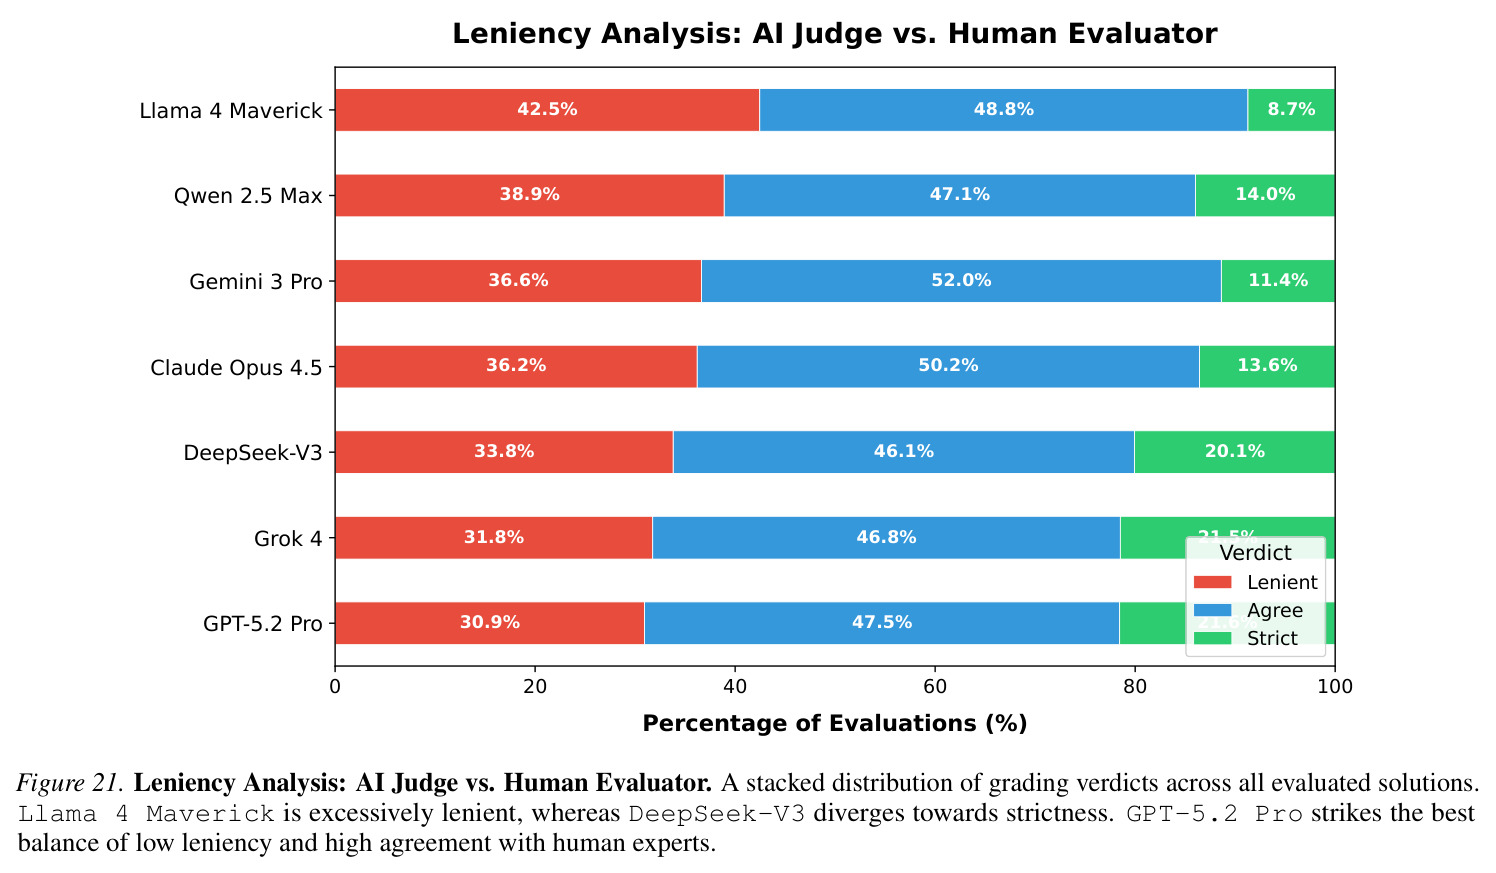
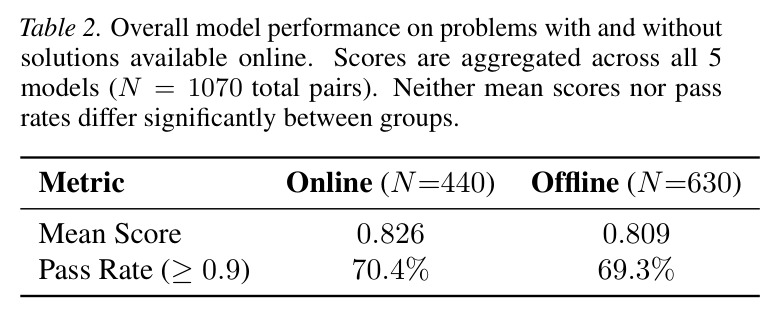
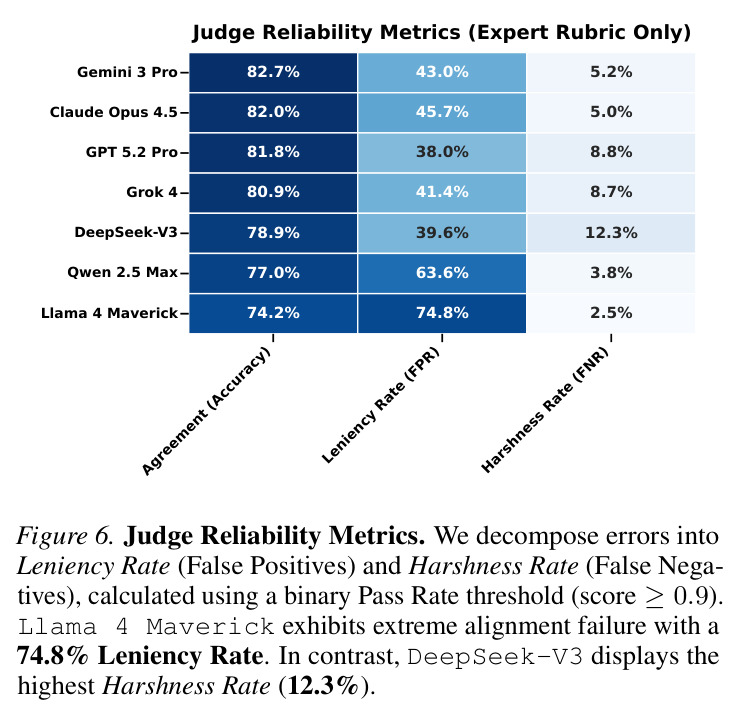
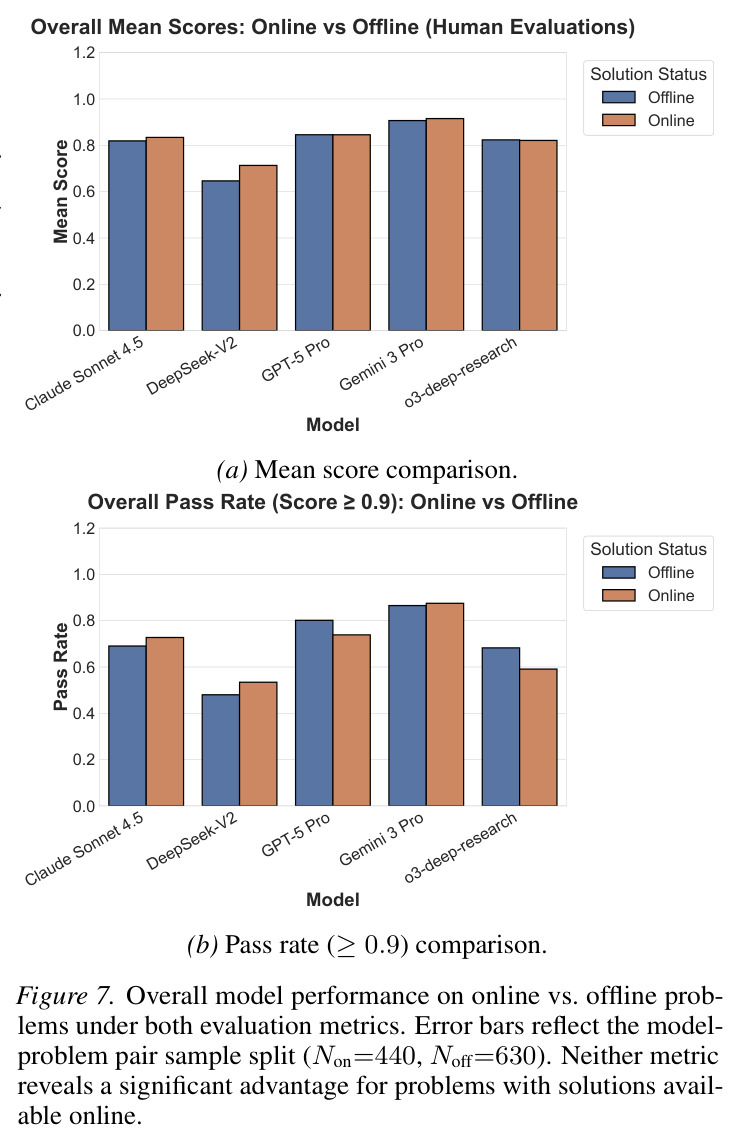
技术新颖性体现在三方面。第一,将双准则冲突检测引入数学评估,区别于ProofBench(单准则)、FrontierMath(闭式答案)、U-MATH(µ-MATH仅元评估)的方案,能直接量化评分员对约束的服从度;第二,将错误分解为False Positive(奉承式宽松)和False Negative(僵化式严苛),揭示了Agreeableness Bias在数学场景的具体表现——Llama 4 Maverick的假阳性率高达74.8%;第三,引入Contamination-Robust Design,通过ab initio改写+深度搜索审计+统计检验三重保险,证明benchmark本身未被记忆化污染(即使有解的题目也无统计显著的得分优势,$p=0.32$)。整体上,这是第一个把评分员可靠性作为一等公民、用人类评分时间作为对齐信度的数学评测基准。
实验结果
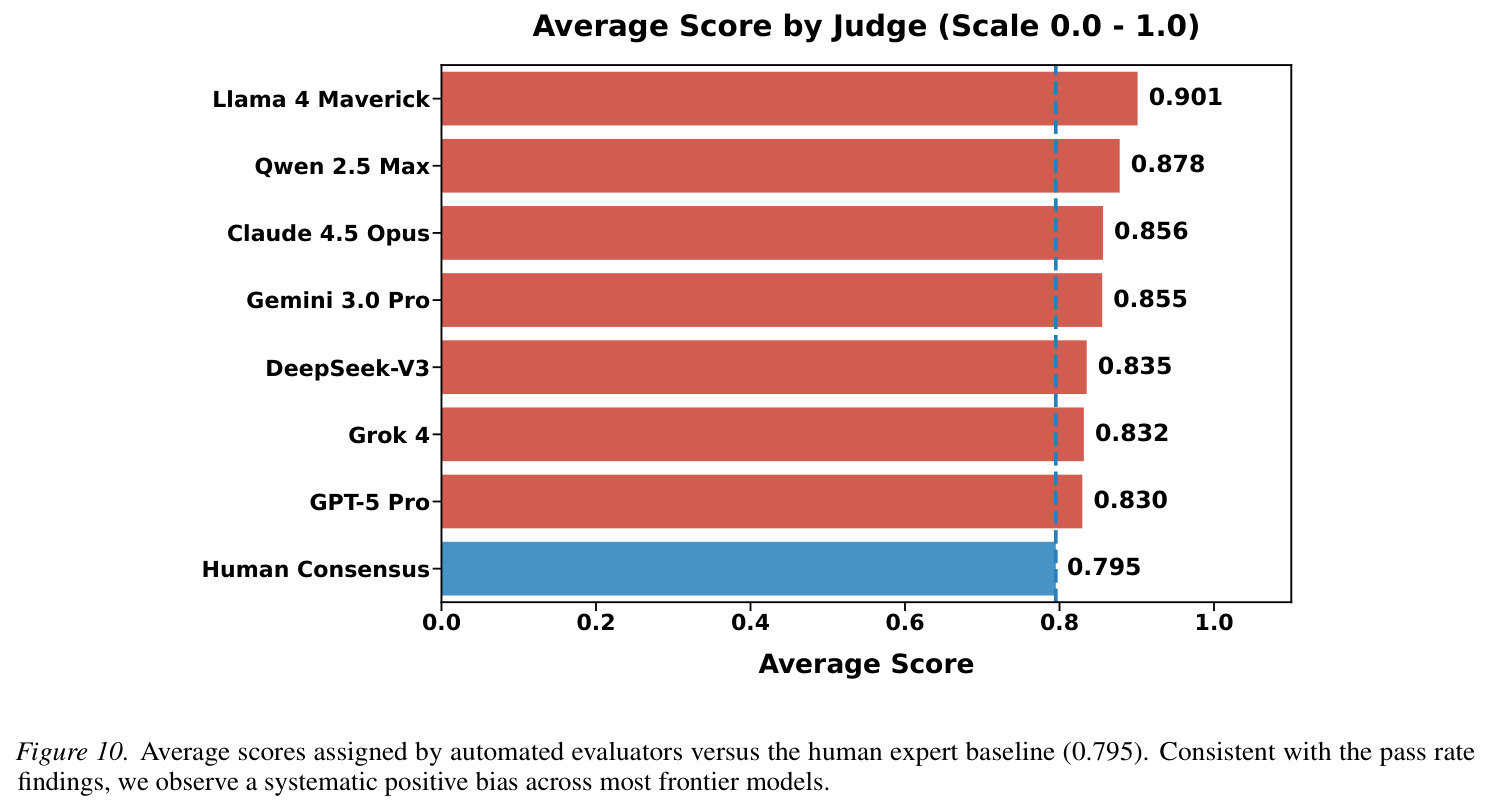
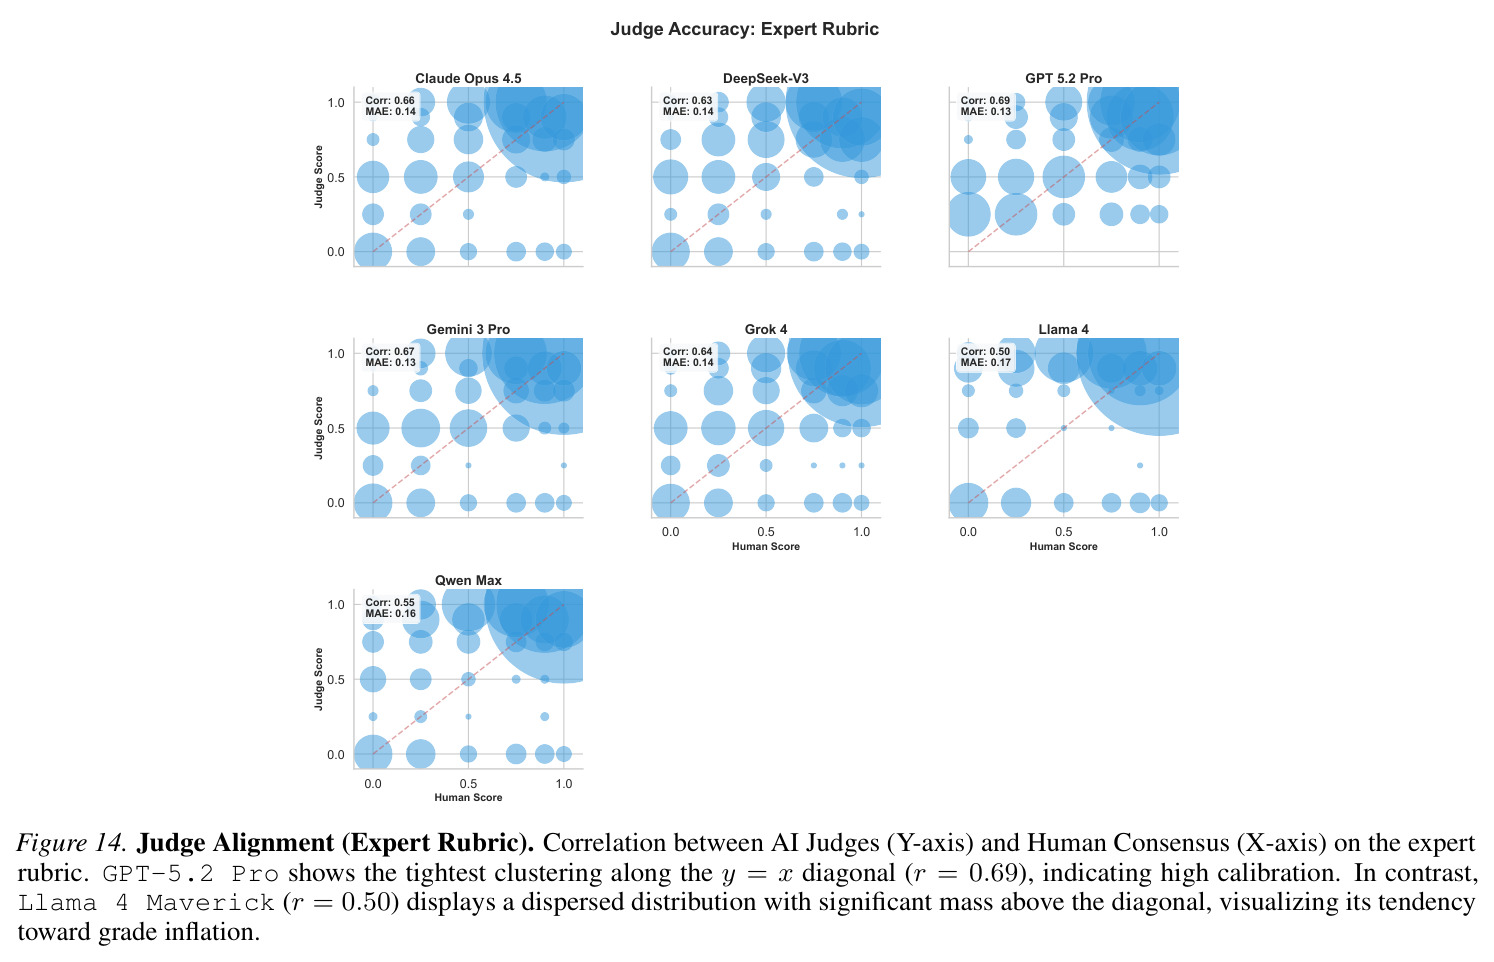
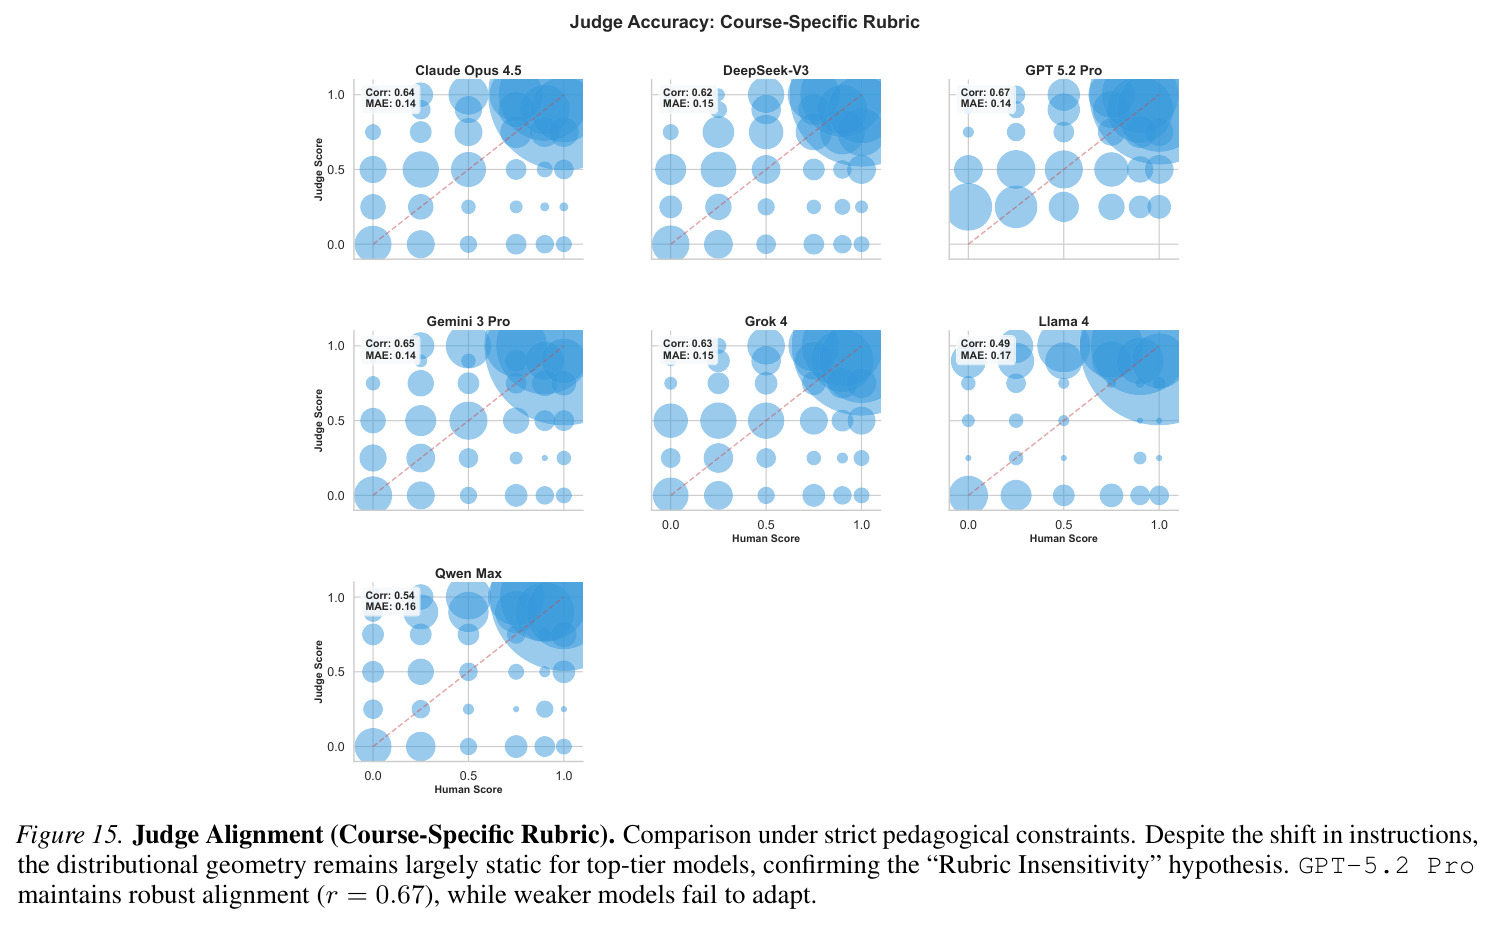
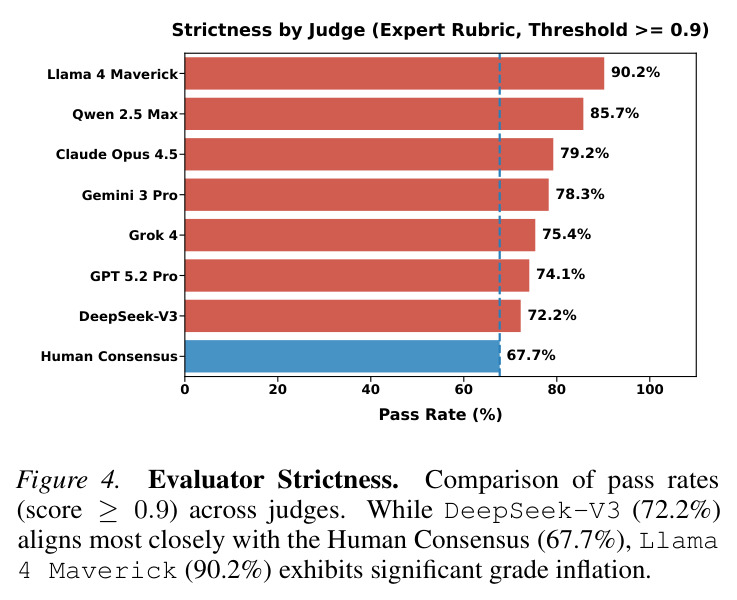
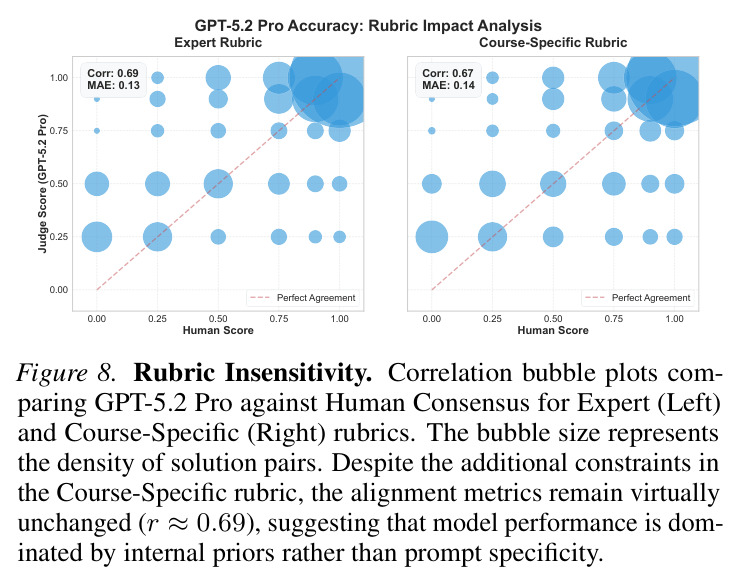
核心发现可归纳为五个层次。第一,**前沿模型解题能力分层明显**:Gemini 3.0 Pro以86.4%通过率和0.91平均分领跑,GPT-5 Pro次之(76.8%/0.84),DeepSeek-Prover-V2垫底(45.2%/0.635)。第二,**离散-连续分裂显著**:在ODE、Complex Analysis等连续域上模型几乎饱和(Claude Sonnet 4.5和Gemini 3.0 Pro在ODE均100%通过),但在Combinatorics、Graph Theory等需要构造性搜索的离散域上骤降(Claude Sonnet 4.5在组合数学仅27.3%,DeepSeek-Prover-V2在图论为0%)。第三,**对齐鸿沟双向分布**:在Combinatorics中AI大幅宽松(Llama 4 Maverick偏置+0.36,Qwen 2.5 Max +0.30),但在Complex Analysis中AI反而过度严苛(DeepSeek-V3 -0.14,Grok 4 -0.15),表明LLM评分员对标准保角积分中的隐含步骤缺乏专家式宽容。第四,**奉承陷阱广泛存在**:Llama 4 Maverick假阳性率74.8%,即使最强GPT-5.2 Pro也有38.0%假阳性率;GPT-5.2 Pro甚至给纯API错误消息打0.5分。第五,**Rubric Insensitivity(准则不敏感)**:把准则从Expert换成更严格的Course-Specific后,GPT-5.2 Pro的Pearson相关系数仅从$r=0.69$微降到$r=0.67$,MAE从0.13升到0.14,说明prompt工程的边际收益极小,模型内部先验压倒了显式负约束。
查看结构化数据
| 任务 | 指标 | 本文 | 基线 | 提升 |
|---|---|---|---|---|
| 整体解题平均分(10个学科汇总) | Average Score (0.0–1.0) | Gemini 3.0 Pro: 0.906 | Claude Sonnet 4.5: 0.792, DeepSeek-Prover-V2: 0.635 | Gemini 3.0 Pro较DeepSeek-Prover-V2领先+0.271(相对提升42.7%) |
| 整体解题通过率(score≥0.9) | Pass Rate (%) | Gemini 3.0 Pro: 86.4% | 人类专家基线: 67.7%, DeepSeek-Prover-V2: 45.2% | Gemini 3.0 Pro超过人类基线+18.7个百分点(仍可能为评分宽松所致) |
| ODEs域解题通过率 | Pass Rate (%) | Gemini 3.0 Pro: 100%, Claude Sonnet 4.5: 100% | DeepSeek-Prover-V2: 79.2% | 两个最强模型在连续程序化域上完全饱和 |
| Combinatorics域解题通过率 | Pass Rate (%) | GPT-5 Pro: 72.7%, Gemini 3.0 Pro: 72.7% | DeepSeek-Prover-V2: 9.1%, Claude Sonnet 4.5: 27.3% | Gemini 3.0 Pro比DeepSeek-Prover-V2高+63.6个百分点(8倍提升) |
| Graph Theory域解题通过率 | Pass Rate (%) | Gemini 3.0 Pro: 89.5% | Claude Sonnet 4.5: 15.8%, o3-deep-research: 42.1% | Gemini 3.0 Pro比Claude Sonnet 4.5高+73.7个百分点(5.7倍提升) |
| AI评分员对齐准确度(GPT-5.2 Pro) | Pearson Correlation with Human | Expert Rubric: r=0.69, MAE=0.13 | Course-Specific Rubric: r=0.67, MAE=0.14 | 换更严格准则后相关系数仅降-0.02,表明rubric工程边际收益极小 |
| AI评分员宽松度(vs人类67.7%基线) | Pass Rate (%) | Llama 4 Maverick: 90.2% | DeepSeek-V3: 72.2% (最接近人类), 人类基线: 67.7% | Llama 4 Maverick比人类基线宽松+22.5个百分点(高奉承评分员代表) |
| 反污染检验(在线解 vs 无解) | Mean Score Gap (online−offline) | 整体gap: +0.017, p=0.32(Welch t检验) | DeepSeek-Prover-V2 gap: +0.067, p=0.18(最显著但仍不显著) | 所有模型p值>0.05,证明无统计显著的污染效应 |
局限与改进
作者明确承认三点局限:第一,静态专家基线可能排除某些有效的非标准证明(如使用非常规引理但仍正确的论证),导致假阴性;第二,研究仅限英语数学推理,未覆盖中文/俄文等其他语言;第三,存在自偏好偏差风险——GPT-5.2 Pro参与了Expert Rubric的初始合成,理论上可能使其评估分数系统性偏高(虽然专家做了迭代修改)。基于实验数据还可观察到的额外局限:(4) 解题模型仅用5个,2026年新模型(如GPT-5.2 Pro本身、Claude Sonnet 4.6)未参与解题测试,可能高估了模型代际差距;(5) 评分员与解题员在某些情况下是同一家族(如GPT-5 Pro解题、GPT-5.2 Pro评分),自评分效应未充分剥离;(6) 数据集规模仅272题,对罕见子领域(如Complex Analysis只有12题)统计功效有限;(7) Prompt-Compliance Trap实验显示LLM评分员会惩罚指出题目错误的解题者,这本身是双向的——也可能是评分员在正确执行按题目要求评分指令,只是与本文倡导的重实质轻形式立场冲突。
独立分析的弱点
可独立分析的主要弱点有三处。第一,**Rubric Insensitivity问题本身**:既然prompt工程无法显著改变LLM评分行为,QEDBench的对照实验就难以产生可操作改进建议——它诊断出问题但开出的药方(process supervision)比较空泛。具体可改进方向:可尝试少样本对抗校准,即在评分prompt里嵌入若干已知错误证明应当被打低分的in-context示例,测试是否能突破先验。第二,**评分员与解题员家族重叠**:GPT-5 Pro解题而GPT-5.2 Pro评分,可能存在同源偏见未被剥离。改进方向是引入完全独立的第三方家族评分员(如纯开源模型Mixtral、Yi等)做盲法对照。第三,**未解的Prompt-Compliance悖论**:当题目本身就是错的(如Algorithms Problem 19的MST双向蕴含),LLM评分员正确识别出解题者不按题目要求证明而扣分,却被作者视为缺陷。但若解题者指出题目错误,评分员反而奉承题目给低分——这其实是评分员在严格执行按用户指令评分,与识别数学真伪是两个任务。改进方向是引入题目真伪审计子任务,让评分员同时评估题目本身。
未来方向
作者在第7节明确提出未来方向:(1) 引入过程监督(Process Reward Models, PRM)和对抗训练,而非继续在prompt层面修补;(2) 用更细粒度的方法(如对错误类型做子层级分类——未声明假设、循环论证、计算错误、未覆盖边界情形)来诊断失败;(3) 量化评分员被错误信号污染后的训练下游效应(如用奉承型评分员做RLHF会强化什么行为)。基于成果可延伸的方向还包括:(4) 把QEDBench从英文扩展到多语种数学证明;(5) 与Lean等自动形式化系统进行混合验证——让LLM评分员先生成证明草稿,再让形式化系统逐步验证每个引理;(6) 开发评分员鲁棒性测试集——专门构造那些能区分真实理解和表面排版的对抗性证明,类似于本文已经做的Graph Theory Problem 14(缺连通性假设)和Discrete Math Problem 27(Grünbaum不可能构造)。
复现评估
复现评估整体良好。**开源情况**:作者明确将完整benchmark公开发布在GitHub(QEDBench 2026链接),包含1300+份证明、272题、双准则评分细则、评估日志。**数据**:272道题来自Beals (2004)、Dummit & Foote (2003)、Diestel (2017)等公开教材及资格考试,重写形式后做了反污染审计。**算力**:解题阶段每题最多16384 token、2000秒超时;评分阶段是LLM推理调用,可使用同API。**难度**:低-中等,主要是数据收集(专家人工评分耗时但外包给48位PhD后已解决)和API调用成本;最重的人工成本(1000+小时)已由团队完成。**潜在阻碍**:(a) 部分解题模型(如o3-deep-research)可能已下线或API变化;(b) 2026年模型迭代极快,前沿模型基线很快过时,需要持续更新;(c) 反污染审计的严格区分等价/类似题标准主观性强,其他研究者复现时可能划线不一;(d) 人工评分的6档尺本质上有评分者间信度风险(虽然作者用48人分散题-人匹配缓解),但完全复现仍受限于专家资源。
论文图表