← 返回 2026-06-04

当图Token下沉:图语言模型的机制分析 When Graph Tokens Sink: A Mechanistic Analysis of Graph Language Models

Ding Zhang, Runtao Zhou, Wenqing Zheng, Rizal Fathony, Bayan Bruss, Chirag Agarwal 📅 2026-06-02 👍 3 2026-07-13 08:36
Transformer分析 图表示学习 图语言模型 机制可解释性 注意力机制

揭示图语言模型中图sink token的激活模式与语义效用解耦现象

前置知识

图语言模型

图语言模型是一类将大型语言模型与图结构数据结合的架构。它们通过将图拓扑和节点信息转换为离散或软的图token,使transformer能够联合处理结构化图输入和文本指令。常见的GLM设计包括节点对齐的图token(如LLaGA,将图的邻域树结构直接展开为token序列)和编码器生成的图token(如TEA-GLM,先用GNN编码器聚合图结构,再投影到LLM的嵌入空间)。

本文研究GLM的核心问题——图token在LLM内部如何被解释和利用,这是理解LLM能否有效处理非欧几里得结构数据的关键。

注意力sink

注意力sink是Transformer模型中出现的一种结构性病理现象,指某些token虽然语义重要性有限,但却吸引异常大的注意力权重或产生极端的激活值。这些token不是用于传递语义信息,而是起到稳定网络内部计算的作用。在文本LLM中,已知的sink维度包括LLaMA2-7B的{1415, 2533}等,这些维度上的激活值异常高。

本文的核心假设是图token可能也会成为sink,作者需要区分激活显著和真正承载图信息这两种情况,这直接关系到GLM的设计原理是否成立。

Logit lens分析

Logit lens是一种机制可解释性技术,用于探究模型在推理过程中学到的内部表示。它的核心思想是将模型各层的隐藏状态通过LM头投影回词汇表空间,解码出最可能的token。这种方法允许我们查看模型在某层看到了什么,从而理解信息如何在网络中流动和转换。

本文使用logit lens来解码图token的隐藏状态,验证它们是否真正编码了任务相关的标签、节点语义或拓扑概念,这对理解图sink token的实际功能至关重要。

节点对齐与编码器嵌入

这是两种主要的图token设计范式。节点对齐(如LLaGA)直接将图的邻域结构展开为固定形状的token序列,例如Neighborhood Detail模板将中心节点放在索引0,按跳数组织其邻域。编码器嵌入(如TEA-GLM)先用GNN编码器(如GraphSAGE)聚合邻域结构到中心节点表示,再通过线性投影将这个表示映射到固定数量的可学习图token嵌入。

本文选择LLaGA和TEA-GLM作为研究对象,因为它们代表了两种主流的GLM设计路线,对比两者有助于区分sink行为是由特定设计引起的还是GLM的普遍现象。

研究动机

图语言模型的核心代表性假设一直未被充分验证:即本质上非欧几里得的图拓扑可以被扁平化为序列化的token流,并被LLM忠实地解析而不触发结构性病理。这与已知的transformer动态存在根本矛盾。机制可解释性研究表明,transformer在处理序列数据时高度容易出现结构性病理。例如,在文本和视觉模态中,模型会常规地形成注意力sink,即某些token积累异常大的内部显著性和注意力分数,不是为了传达语义含义,而仅仅是为了稳定网络的内部计算。这对于GLMs构成了深刻的张力:图token被显式注入来传递关键的结构信息,但它们却受到完全相同的transformer动态的影响,这些动态已知会劫持token用于非语义的架构原因。虽然初步研究注意到图输入中存在类似sink的注意力模式,但一个更深层的脆弱性仍未解决:当一个图token在LLM内部变得响亮时,模型实际上是在利用它进行拓扑推理,还是仅仅利用token化的图结构来构建架构产物?

本文的目标是本文通过审计两个代表性GLM设计(节点对齐图token的LLaGA和编码器生成的图token的TEA-GLM)的底层激活力学,研究LLM如何通过图sink行为的视角处理图token。作者在图模态中定义了图sink token,并展示了三个关键发现:首先,图sink token一致地作为稀疏的激活级别异常值出现,并且严重偏向于早期图token位置,但这种内部显著度并不可靠地转化为注意力主导性或下游效用;其次,有针对性的干预实验显示这些高度显著的token对下游模型性能贡献惊人地小;最后,可解释性分析首次证明图sink token主要捕获弱领域级信号,而不是预期的特定于任务或拓扑感知的结构信息。这些结果揭示了激活级别显著性与图语义效用之间的严重解耦,表明当前GLM在将图结构映射到LLM token空间后,并不会自动形成可用的拓扑感知内部表示。

与已有工作不同的是,本文的独特切入角度是首次从机制可解释性的角度系统研究图语言模型中图token的行为,特别是图sink token现象。与之前仅关注注意力模式的研究不同,作者同时分析了激活模式、注意力分布和实际效用三个维度,并通过剪枝、交换、重定位等干预实验和logit lens分析,揭示了激活级别显著性与图语义效用之间的解耦。这种多维度、干预式的研究方法在GLM领域是首创的,为理解LLM如何处理图结构信息提供了新的视角。

核心方法

本文的方法基于一个核心假设:图语言模型中的图token可能会表现出sink行为,即某些图token在激活空间中表现出异常显著的响应,但这种激活显著度并不一定意味着它们真正承载了图结构信息。为了验证这个假设,作者设计了一个系统的分析框架,包括sink token检测、注意力模式分析、干预实验和logit lens分析四个主要组件。首先,作者基于激活幅度定义图sink token,并在多个数据集和任务上检测它们的分布特征。然后,作者分析这些sink token是否成为query token的主要注意力目标。接下来,作者设计剪枝、交换和重定位干预,测试移除或修改sink token是否会影响下游性能。最后,作者使用logit lens解码图token的隐藏状态,检查它们是否编码了任务相关的拓扑信息。

本文的核心创新点在于首次区分了激活级别显著性和图语义效用这两个概念。作者发现,在GLMs中,图sink token主要作为激活级别的异常值出现,可以在特定隐藏维度上的巨大激活值来识别,并且偏向于早期图token位置。然而,这种激活级别的显著度并不暗示这些token是图信息的主要载体。与经典的语言和视觉-语言模型中的注意力sink不同,图sink token不一定吸引来自query token的最大注意力权重。通过剪枝、重定位和交换干预实验,作者证明图sink token不是下游预测的最重要语义或结构token。这一发现揭示了当前图token构建、放置和对齐机制的根本局限性:它们没有自然地形成完全可用的拓扑感知内部表示,而是表现出激活级别显著性和图语义效用之间的解耦。

方法步骤详情

本文的方法分为四个主要步骤。步骤1是图sink token检测,作者定义了一个sink特征函数phi和阈值tau。给定一个包含文本token和图token的混合token序列,设I_g为图token索引集合,x_l^j为第l层token j的隐藏状态,其中d是LLM隐藏维度。第l层的图sink token集合定义为I_l^g等于所有j属于I_g且phi(x_{l-1}^j)大于等于tau的j。作者使用激活幅度作为sink特征,给定sink维度集合D_sink,定义phi(x_{l-1}^j)等于D_sink中所有维度d上RMSNorm(x_{l-1}^j[d])的最大值。步骤2是注意力模式分析,作者分析query token对图token的注意力分布,检查sink token是否成为主要注意力目标。步骤3是干预实验,作者设计三种干预:TOP-2 sink移除两个激活幅度最大的图sink token,NON-SINK移除两个随机选择的非sink图token作为对照,SWAP交换两个sink token位置与两个随机选择的非sink位置。步骤4是logit lens分析,作者将TEA-GLM的图token隐藏状态通过LM头投影回词汇表空间,解码最频繁出现的top-1词汇token,检查它们是否编码了任务相关信息。

技术新颖性

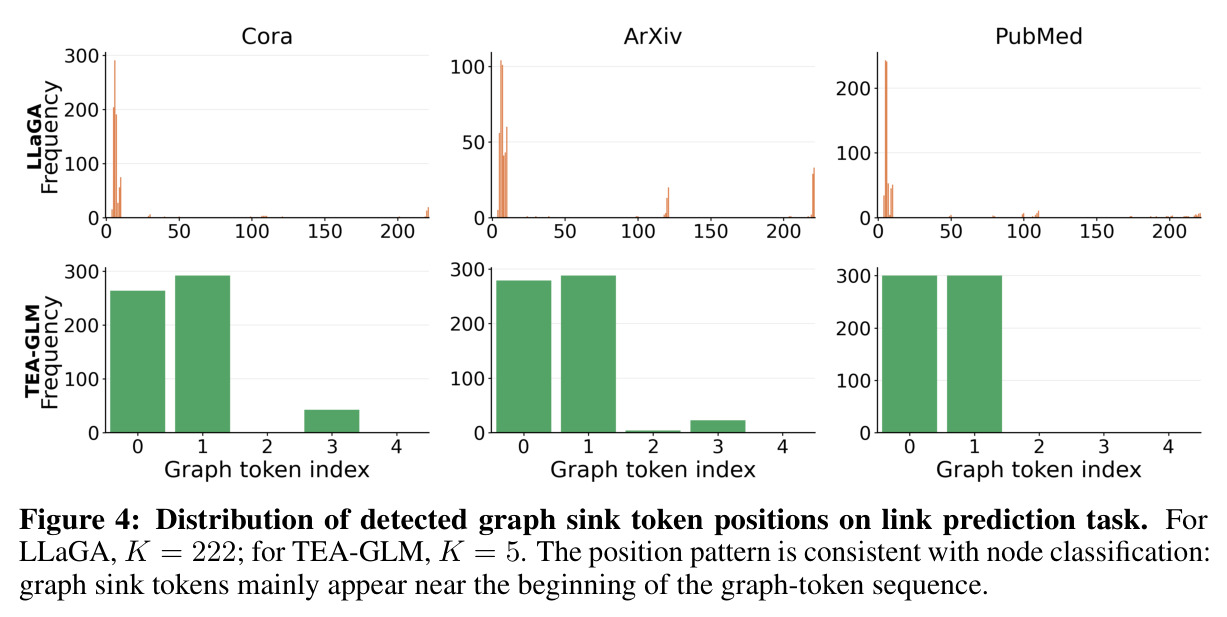
本文的技术新颖性体现在多个方面。首先,作者首次在图语言模型中定义了基于激活的图sink token概念,与之前仅基于注意力的sink定义不同。作者发现sink维度1512在LLaGA和TEA-GLM中都成为主导sink维度,这表明sink行为是在图信息映射到LLM token空间后新出现的,而不仅仅是继承自已知的LLM sink维度如2533。其次,作者发现图sink token的分布严重偏向于早期图token位置:在TEA-GLM中,大多数sink token出现在位置0和1;在LLaGA中,top-2 sink token总是PAD token,而中心节点token(索引0)从未被识别为图sink token。这一发现揭示了激活级别显著性与图语义重要性之间的差距。第三,作者的干预实验首次系统性地测试了sink token的实际功能,发现剪枝top-2 sink token对性能影响微乎其微,而剪枝随机非sink token可能造成更大的性能下降。最后,作者的logit lens分析首次证明图sink token主要捕获弱领域级信号(如paper这样的通用领域术语),而不是预期的任务特定或拓扑感知的结构信息。这一系列创新分析方法为理解GLM的内部机制提供了新的工具和视角。
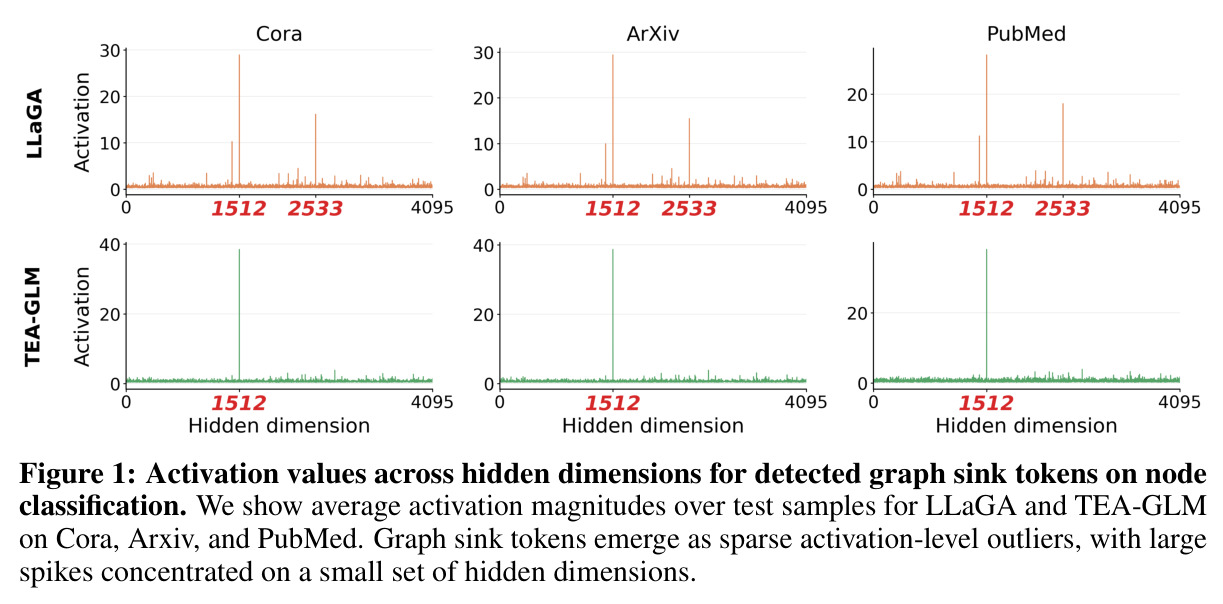
Activation values across hidden dimensions for detected graph sink tokens on node classification. We show average activation magnitudes over test samples for LLaGA and TEA-GLM on Cora, Arxiv, and PubMed. Graph sink tokens emerge as sparse activation-level outliers, with large spikes concentrated on a small set of hidden dimensions.
Figure 1: Activation values across hidden dimensions for detected graph sink tokens on node classification. We show average activation magnitudes over test samples for LLaGA and TEA-GLM on Cora, Arxiv, and PubMed. Graph sink tokens emerge as sparse activation-level outliers, with large spikes concentrated on a small set of hidden dimensions.

实验结果

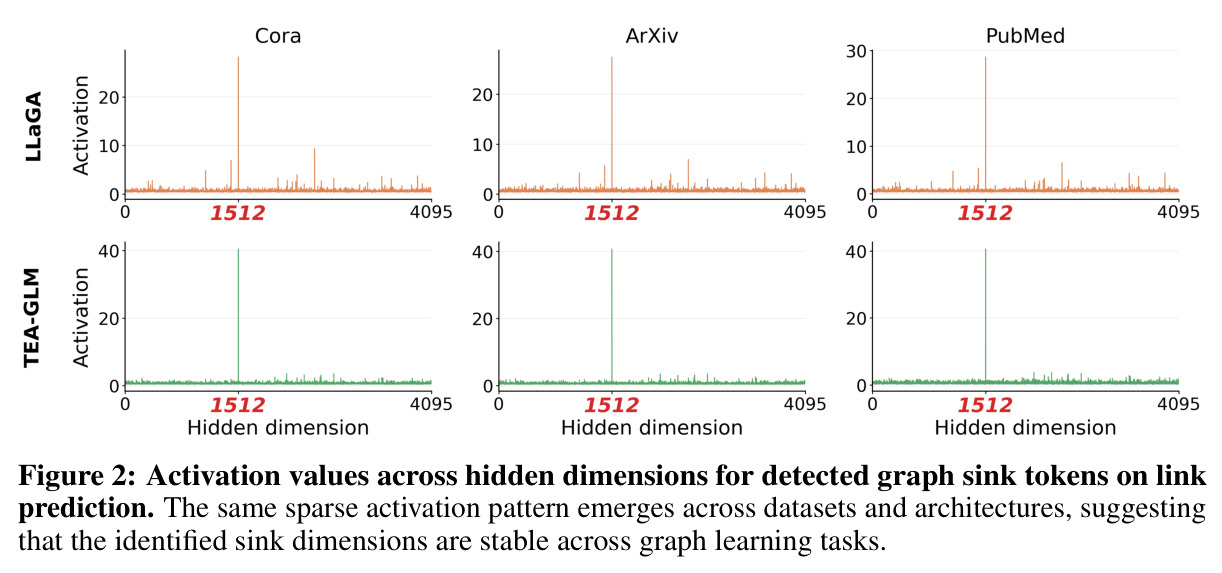
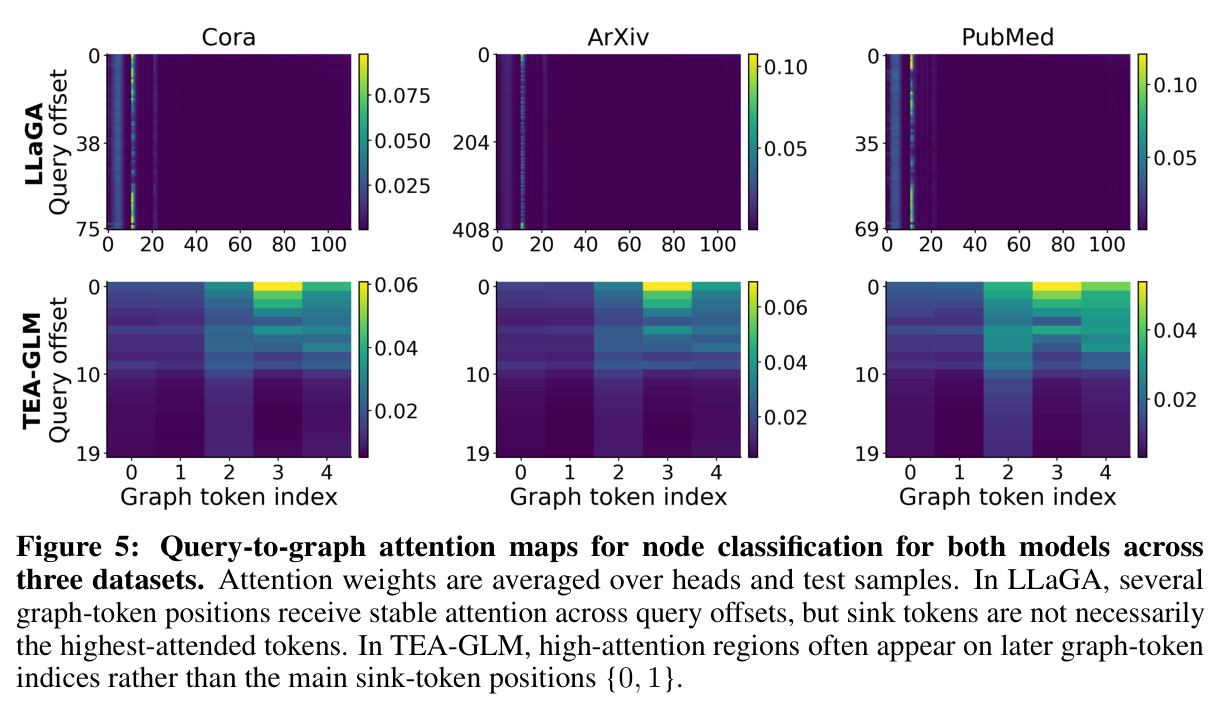
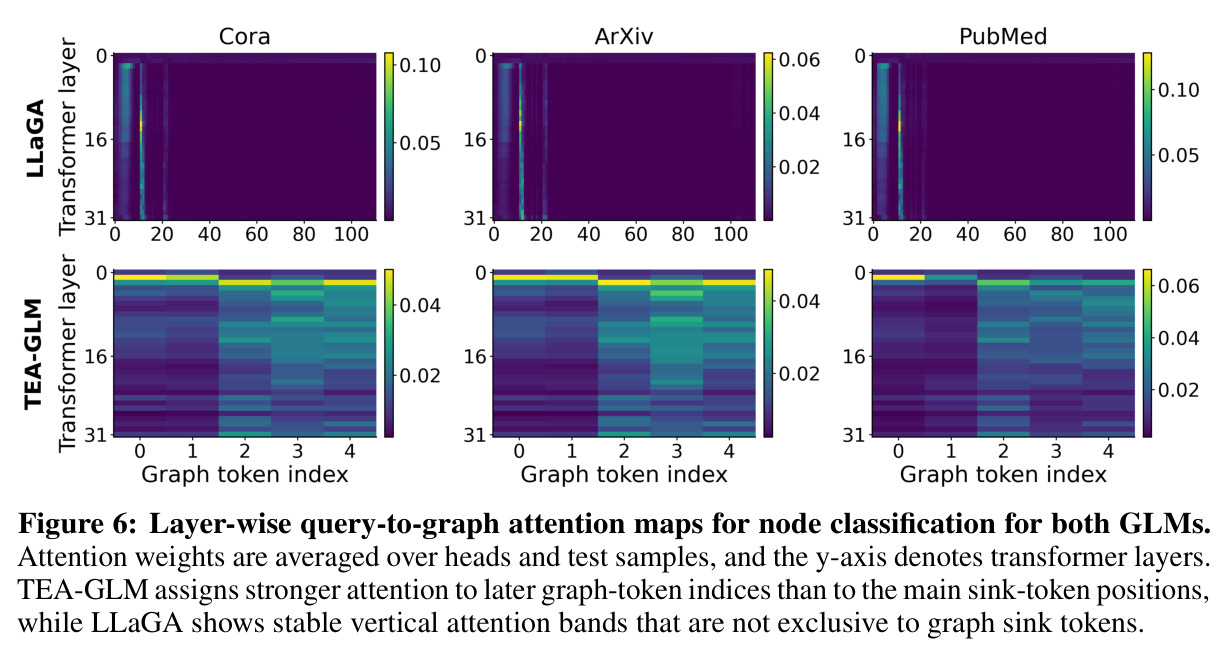
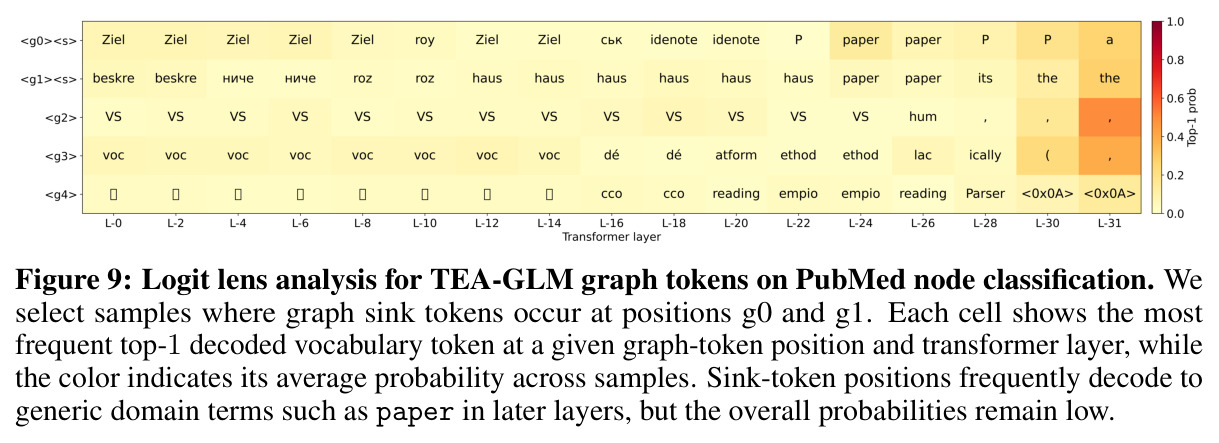
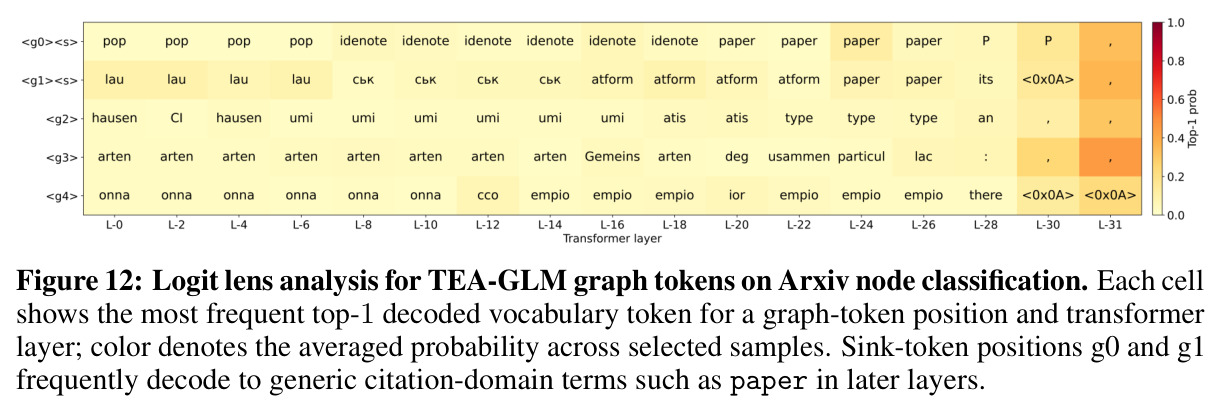
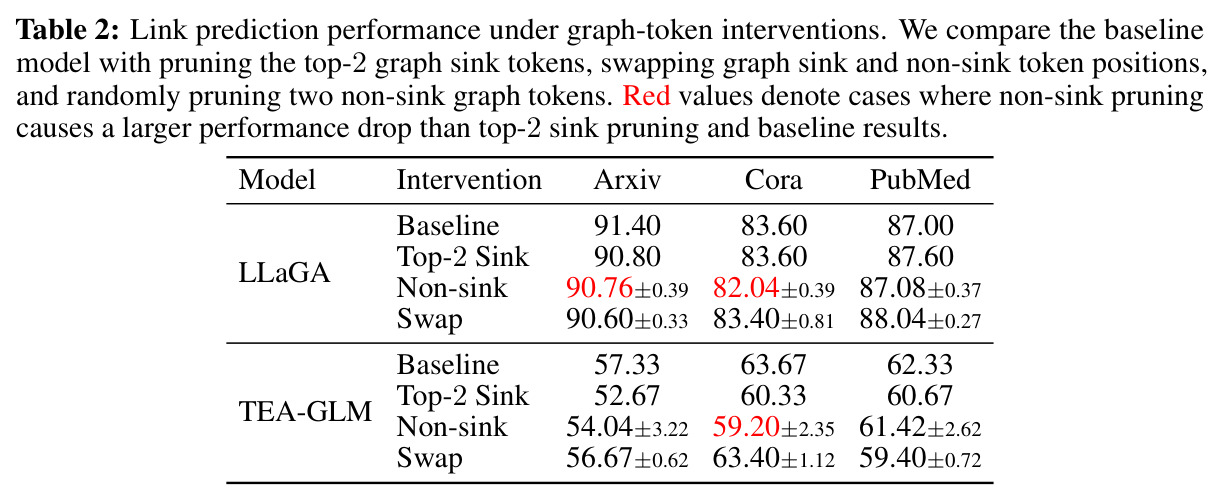
本文的核心发现包括三个方面。首先,图sink token一致地作为稀疏的激活级别异常值出现,可以在特定隐藏维度上的巨大激活值来识别,并且偏向于早期图token位置。在LLaGA中,维度1512在两个任务中重复出现为主导sink维度,维度2533是节点分类任务的另一个sink维度。在TEA-GLM中,维度1512是所有数据集和两个任务的主导sink维度。这表明图sink行为不仅继承自已知的LLM sink维度(如LLaMA基础模型中的2533),维度1512在两种GLM设计中的重复出现指向在图信息映射到LLM token空间后出现的sink行为。其次,激活级别显著度并不可靠地转化为注意力主导性。TEA-GLM的结果显示了sink token和高注意力位置之间的清晰分离:虽然TEA-GLM图sink token主要出现在索引0和1,但平均注意力通常在后来的图token(特别是索引2-4)上更强。LLaGA的注意力图在几个图token位置包含窄的垂直带,表明这些位置跨越query偏移接收稳定注意力。其中一些带与第2节中识别的图sink区域重叠,但这种注意力不是清楚查询特定的,并且sink位置上的平均注意力不一定高于非sink位置。第三,干预实验显示图sink token不是预测关键的。表1显示,剪枝top-2图sink token对LLaGA和TEA-GLM的节点分类影响很小。相反,剪枝随机非sink token在几个设置中导致更大的下降,特别是对于LLaGA。在Arxiv数据集上,LLaGA的top-2 sink剪枝保持77.00%的准确率(与基线相同),而非sink剪枝平均导致74.36加或减1.44%的准确率,下降了2.64个百分点。在Cora数据集上,top-2 sink剪枝导致88.00%的准确率(仅比基线88.40%下降0.4%),而非sink剪枝平均导致80.48加或减2.47%的准确率,下降了近8个百分点。类似的模式出现在链路预测中(附录A.1,表2)。最后,logit lens分析显示,图sink token主要暴露通用领域级术语而不是任务特定或拓扑感知的图信息。在PubMed节点分类上,从大约第20层开始,sink token位置g0和g1频繁解码为paper,而不是数据集特定的标签或图拓扑信息。
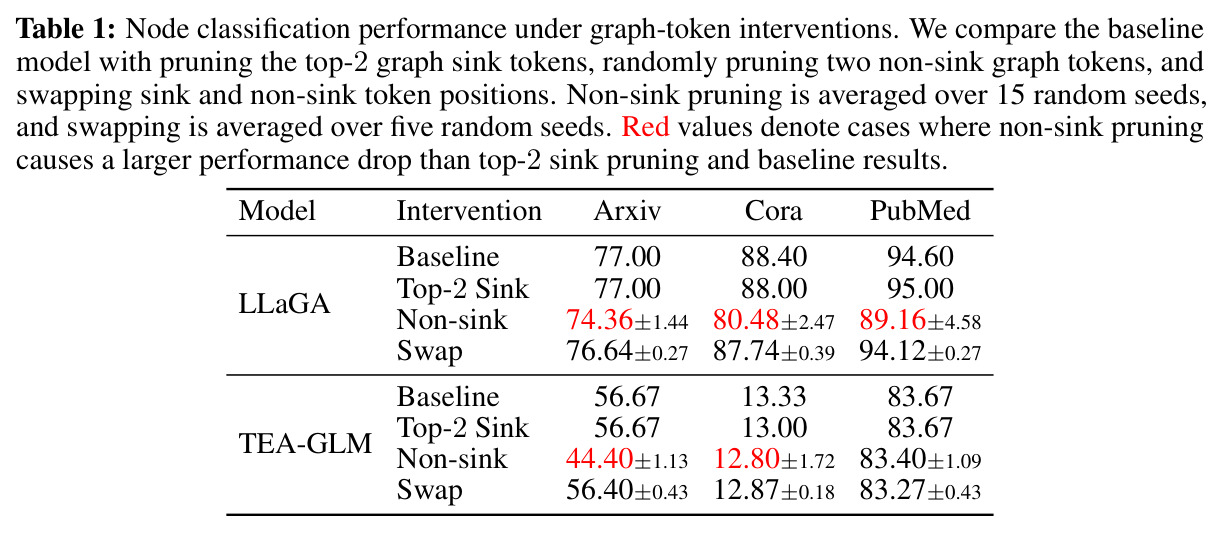
Node classification performance under graph-token interventions. We compare the baseline model with pruning the top-2 graph sink tokens, randomly pruning two non-sink graph tokens, and swapping sink and non-sink token positions. Non-sink pruning is averaged over 15 random seeds, and swapping is averaged over five random seeds. Red values denote cases where non-sink pruning causes a larger performance drop than top-2 sink pruning and baseline results.
Table 1: Node classification performance under graph-token interventions. We compare the baseline model with pruning the top-2 graph sink tokens, randomly pruning two non-sink graph tokens, and swapping sink and non-sink token positions. Non-sink pruning is averaged over 15 random seeds, and swapping is averaged over five random seeds. Red values denote cases where non-sink pruning causes a larger performance drop than top-2 sink pruning and baseline results.
Link prediction performance under graph-token interventions. We compare the baseline model with pruning the top-2 graph sink tokens, swapping graph sink and non-sink token positions, and randomly pruning two non-sink graph tokens. Red values denote cases where non-sink pruning causes a larger performance drop than top-2 sink pruning and baseline results.
Table 2: Link prediction performance under graph-token interventions. We compare the baseline model with pruning the top-2 graph sink tokens, swapping graph sink and non-sink token positions, and randomly pruning two non-sink graph tokens. Red values denote cases where non-sink pruning causes a larger performance drop than top-2 sink pruning and baseline results.
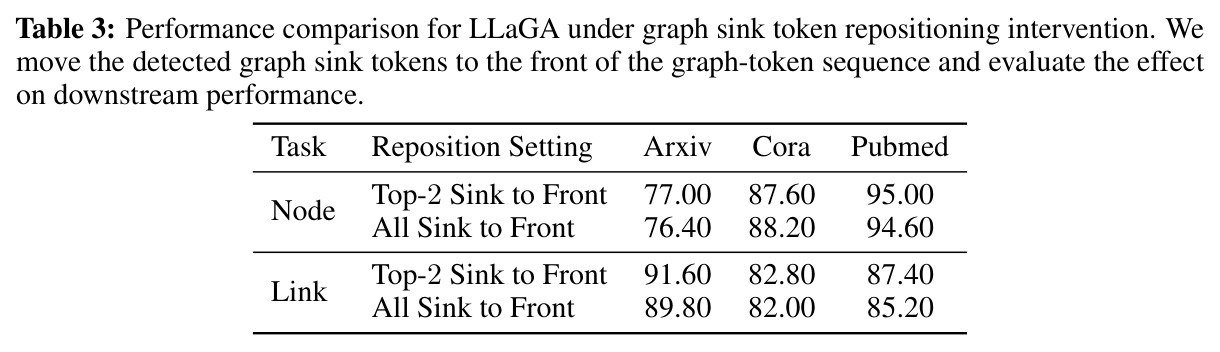
Performance comparison for LLaGA under graph sink token repositioning intervention. We move the detected graph sink tokens to the front of the graph-token sequence and evaluate the effect on downstream performance.
Table 3: Performance comparison for LLaGA under graph sink token repositioning intervention. We move the detected graph sink tokens to the front of the graph-token sequence and evaluate the effect on downstream performance.
Activation values across hidden dimensions for detected graph sink tokens on link prediction. The same sparse activation pattern emerges across datasets and architectures, suggesting that the identified sink dimensions are stable across graph learning tasks.
Figure 2: Activation values across hidden dimensions for detected graph sink tokens on link prediction. The same sparse activation pattern emerges across datasets and architectures, suggesting that the identified sink dimensions are stable across graph learning tasks.
Distribution of detected graph sink token positions on node classification task. For LLaGA, K = 111; for TEA-GLM, K = 5. Graph sink tokens are biased toward early graph-token positions. In LLaGA, a great portion of detected sink tokens are [PAD] tokens.
Figure 3: Distribution of detected graph sink token positions on node classification task. For LLaGA, K = 111; for TEA-GLM, K = 5. Graph sink tokens are biased toward early graph-token positions. In LLaGA, a great portion of detected sink tokens are [PAD] tokens.
Distribution of detected graph sink token positions on link prediction task. For LLaGA, K = 222; for TEA-GLM, K = 5. The position pattern is consistent with node classification: graph sink tokens mainly appear near the beginning of the graph-token sequence.
Figure 4: Distribution of detected graph sink token positions on link prediction task. For LLaGA, K = 222; for TEA-GLM, K = 5. The position pattern is consistent with node classification: graph sink tokens mainly appear near the beginning of the graph-token sequence.
Query-to-graph attention maps for node classification for both models across three datasets. Attention weights are averaged over heads and test samples. In LLaGA, several graph-token positions receive stable attention across query offsets, but sink tokens are not necessarily the highest-attended tokens. In TEA-GLM, high-attention regions often appear on later graph-token indices rather than the main sink-token positions {0, 1}.
Figure 5: Query-to-graph attention maps for node classification for both models across three datasets. Attention weights are averaged over heads and test samples. In LLaGA, several graph-token positions receive stable attention across query offsets, but sink tokens are not necessarily the highest-attended tokens. In TEA-GLM, high-attention regions often appear on later graph-token indices rather than the main sink-token positions {0, 1}.
Layer-wise query-to-graph attention maps for node classification for both GLMs. Attention weights are averaged over heads and test samples, and the y-axis denotes transformer layers. TEA-GLM assigns stronger attention to later graph-token indices than to the main sink-token positions, while LLaGA shows stable vertical attention bands that are not exclusive to graph sink tokens.
Figure 6: Layer-wise query-to-graph attention maps for node classification for both GLMs. Attention weights are averaged over heads and test samples, and the y-axis denotes transformer layers. TEA-GLM assigns stronger attention to later graph-token indices than to the main sink-token positions, while LLaGA shows stable vertical attention bands that are not exclusive to graph sink tokens.
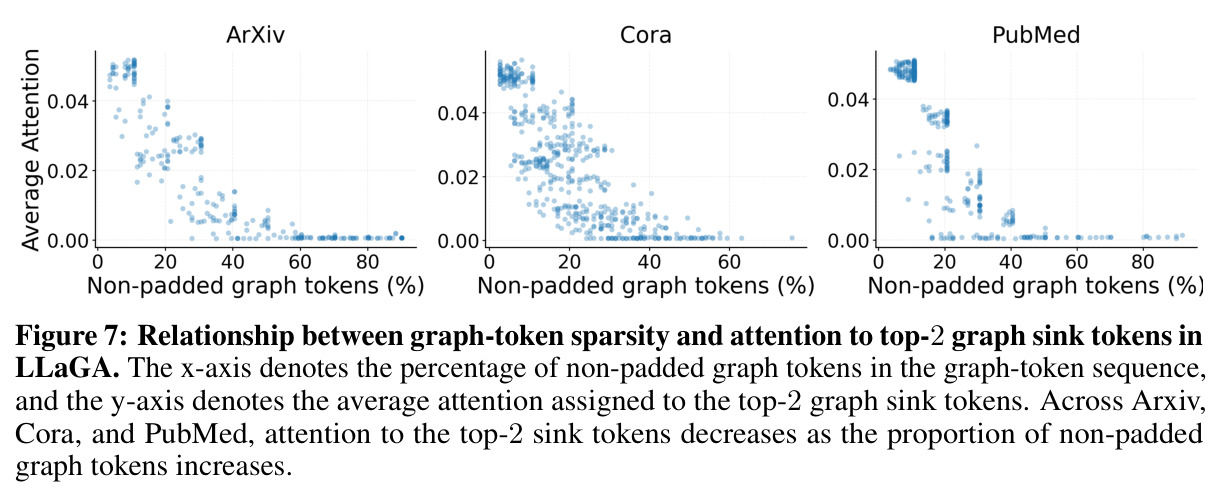
Relationship between graph-token sparsity and attention to top-2 graph sink tokens in LLaGA. The x-axis denotes the percentage of non-padded graph tokens in the graph-token sequence, and the y-axis denotes the average attention assigned to the top-2 graph sink tokens. Across Arxiv, Cora, and PubMed, attention to the top-2 sink tokens decreases as the proportion of non-padded graph tokens increases.
Figure 7: Relationship between graph-token sparsity and attention to top-2 graph sink tokens in LLaGA. The x-axis denotes the percentage of non-padded graph tokens in the graph-token sequence, and the y-axis denotes the average attention assigned to the top-2 graph sink tokens. Across Arxiv, Cora, and PubMed, attention to the top-2 sink tokens decreases as the proportion of non-padded graph tokens increases.
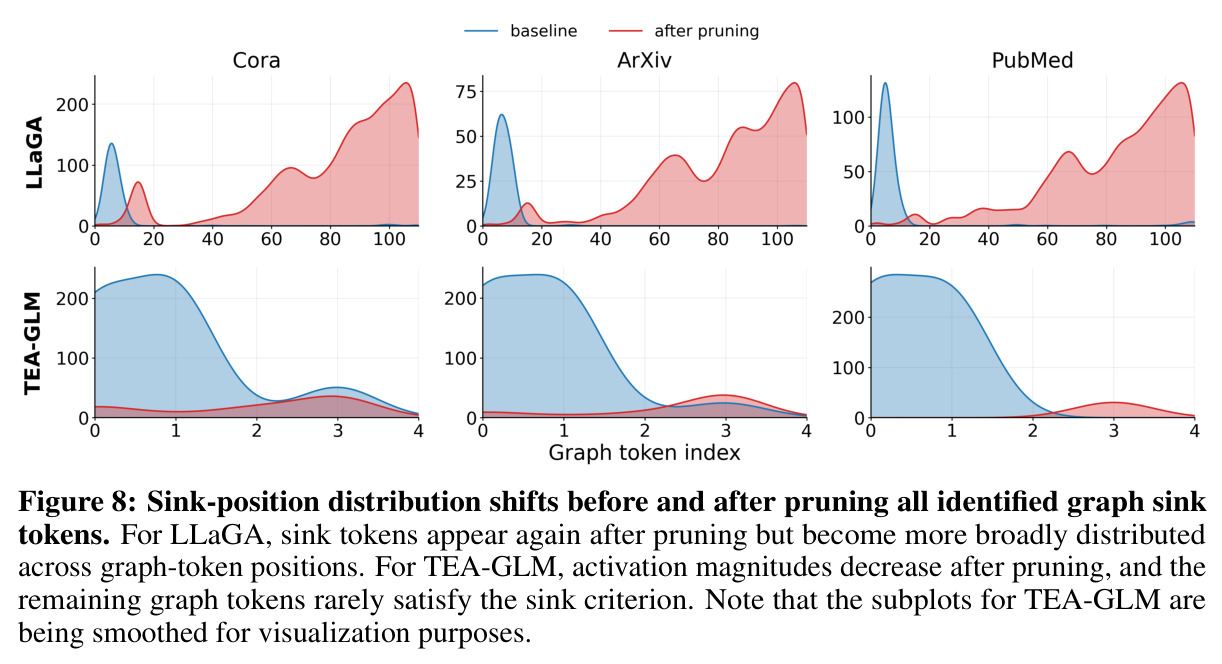
Sink-position distribution shifts before and after pruning all identified graph sink tokens. For LLaGA, sink tokens appear again after pruning but become more broadly distributed across graph-token positions. For TEA-GLM, activation magnitudes decrease after pruning, and the remaining graph tokens rarely satisfy the sink criterion. Note that the subplots for TEA-GLM are being smoothed for visualization purposes.
Figure 8: Sink-position distribution shifts before and after pruning all identified graph sink tokens. For LLaGA, sink tokens appear again after pruning but become more broadly distributed across graph-token positions. For TEA-GLM, activation magnitudes decrease after pruning, and the remaining graph tokens rarely satisfy the sink criterion. Note that the subplots for TEA-GLM are being smoothed for visualization purposes.
Logit lens analysis for TEA-GLM graph tokens on PubMed node classification. We select samples where graph sink tokens occur at positions g0 and g1. Each cell shows the most frequent top-1 decoded vocabulary token at a given graph-token position and transformer layer, while the color indicates its average probability across samples. Sink-token positions frequently decode to generic domain terms such as paper in later layers, but the overall probabilities remain low.
Figure 9: Logit lens analysis for TEA-GLM graph tokens on PubMed node classification. We select samples where graph sink tokens occur at positions g0 and g1. Each cell shows the most frequent top-1 decoded vocabulary token at a given graph-token position and transformer layer, while the color indicates its average probability across samples. Sink-token positions frequently decode to generic domain terms such as paper in later layers, but the overall probabilities remain low.
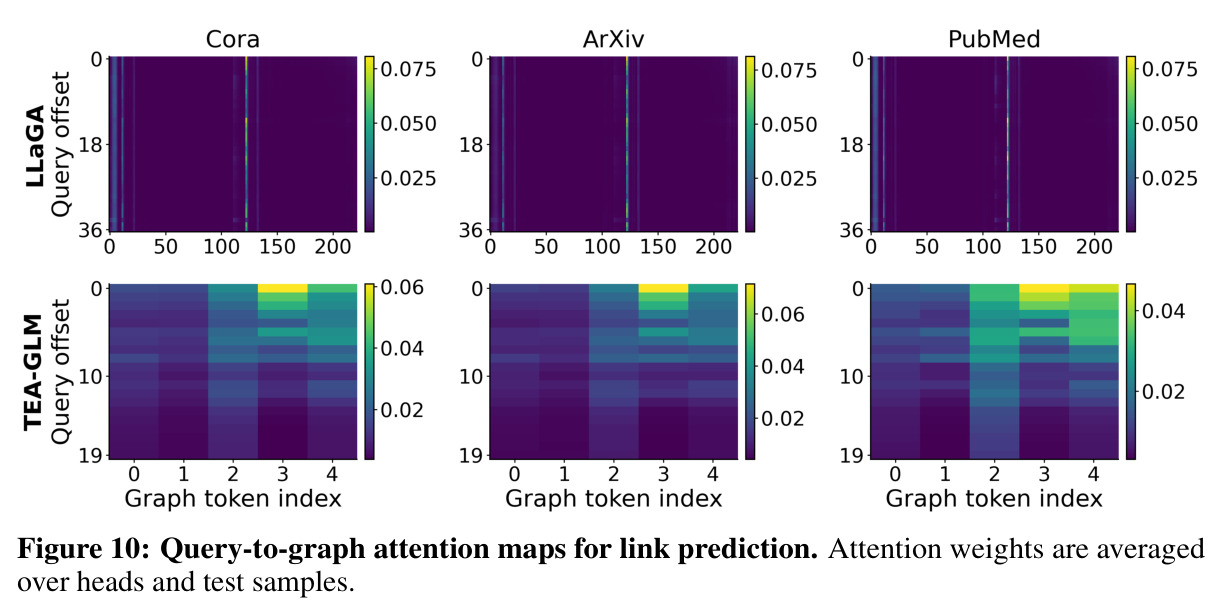
Query-to-graph attention maps for link prediction. Attention weights are averaged over heads and test samples.
Figure 10: Query-to-graph attention maps for link prediction. Attention weights are averaged over heads and test samples.
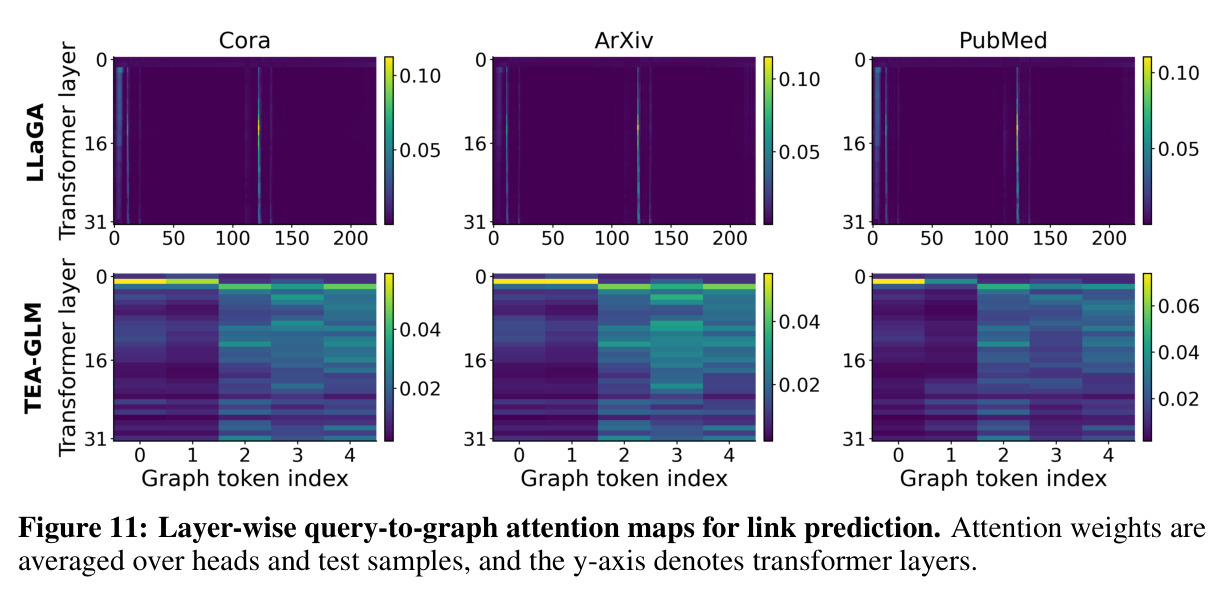
Layer-wise query-to-graph attention maps for link prediction. Attention weights are averaged over heads and test samples, and the y-axis denotes transformer layers.
Figure 11: Layer-wise query-to-graph attention maps for link prediction. Attention weights are averaged over heads and test samples, and the y-axis denotes transformer layers.
Logit lens analysis for TEA-GLM graph tokens on Arxiv node classification. Each cell shows the most frequent top-1 decoded vocabulary token for a graph-token position and transformer layer; color denotes the averaged probability across selected samples. Sink-token positions g0 and g1 frequently decode to generic citation-domain terms such as paper in later layers.
Figure 12: Logit lens analysis for TEA-GLM graph tokens on Arxiv node classification. Each cell shows the most frequent top-1 decoded vocabulary token for a graph-token position and transformer layer; color denotes the averaged probability across selected samples. Sink-token positions g0 and g1 frequently decode to generic citation-domain terms such as paper in later layers.
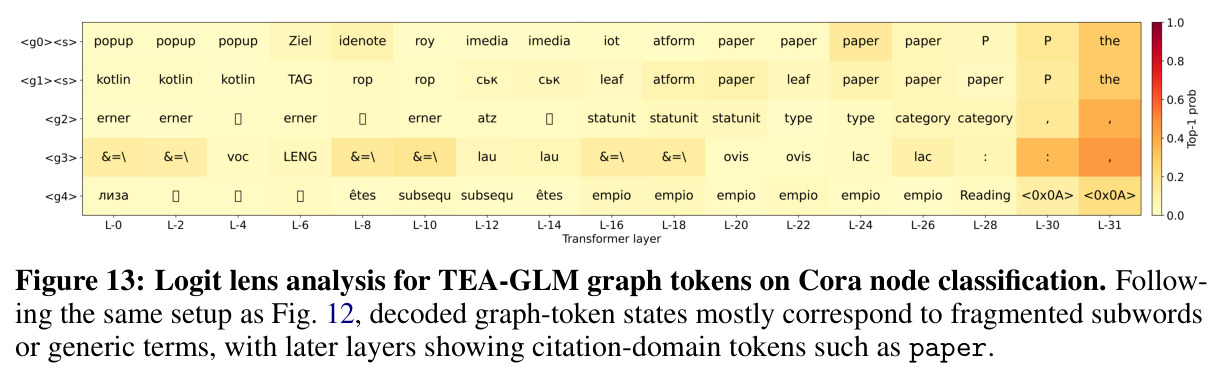
Logit lens analysis for TEA-GLM graph tokens on Cora node classification. Following the same setup as Fig. 12, decoded graph-token states mostly correspond to fragmented subwords or generic terms, with later layers showing citation-domain tokens such as paper.
Figure 13: Logit lens analysis for TEA-GLM graph tokens on Cora node classification. Following the same setup as Fig. 12, decoded graph-token states mostly correspond to fragmented subwords or generic terms, with later layers showing citation-domain tokens such as paper.
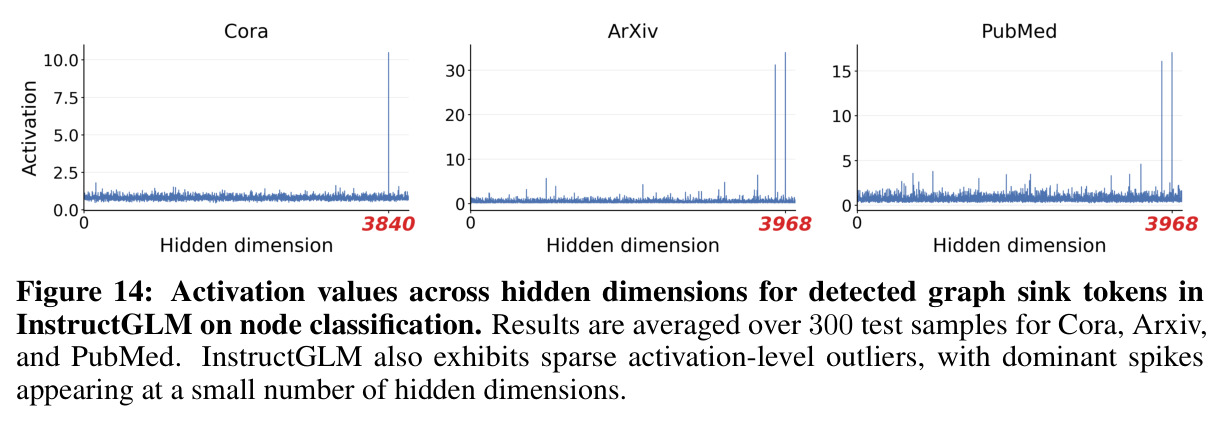
Activation values across hidden dimensions for detected graph sink tokens in InstructGLM on node classification. Results are averaged over 300 test samples for Cora, Arxiv, and PubMed. InstructGLM also exhibits sparse activation-level outliers, with dominant spikes appearing at a small number of hidden dimensions.
Figure 14: Activation values across hidden dimensions for detected graph sink tokens in InstructGLM on node classification. Results are averaged over 300 test samples for Cora, Arxiv, and PubMed. InstructGLM also exhibits sparse activation-level outliers, with dominant spikes appearing at a small number of hidden dimensions.
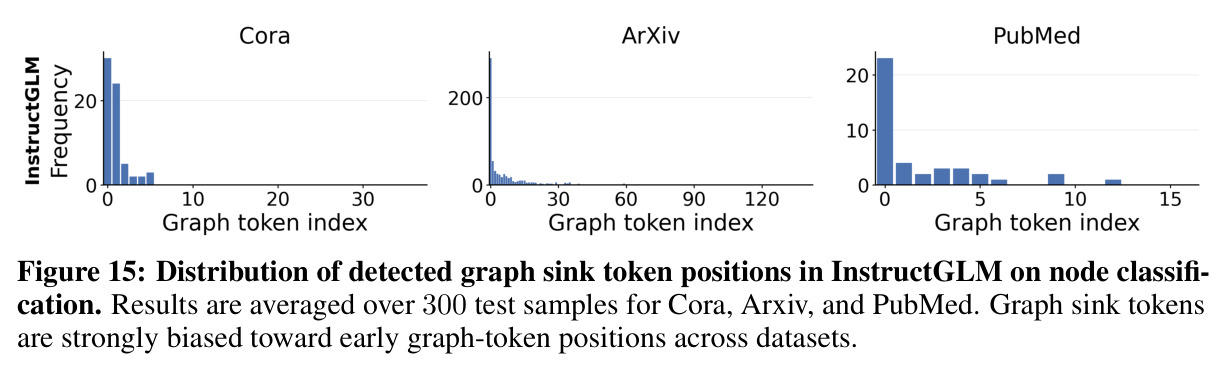
Distribution of detected graph sink token positions in InstructGLM on node classification. Results are averaged over 300 test samples for Cora, Arxiv, and PubMed. Graph sink tokens are strongly biased toward early graph-token positions across datasets.
Figure 15: Distribution of detected graph sink token positions in InstructGLM on node classification. Results are averaged over 300 test samples for Cora, Arxiv, and PubMed. Graph sink tokens are strongly biased toward early graph-token positions across datasets.
查看结构化数据
任务指标本文基线提升
节点分类 准确率 (%) TEA-GLM: Arxiv 56.67, Cora 13.33, PubMed 83.67 TEA-GLM基线: Arxiv 56.67, Cora 13.33, PubMed 83.67 N/A (本文是分析研究,不旨在提升性能)
节点分类 准确率 (%) LLaGA: Arxiv 77.00, Cora 88.40, PubMed 94.60 LLaGA基线: Arxiv 77.00, Cora 88.40, PubMed 94.60 N/A (本文是分析研究,不旨在提升性能)
链路预测 准确率 (%) LLaGA: Arxiv 91.40, Cora 83.60, PubMed 87.00 LLaGA基线: Arxiv 91.40, Cora 83.60, PubMed 87.00 N/A (本文是分析研究,不旨在提升性能)

局限与改进

本文的局限性主要体现在几个方面。作者承认虽然选择了GLM研究中使用的两个代表性GLM架构,但其他GLM架构可能表现出不同的图sink token行为。这可能限制了研究结论的普适性。其次,作者在节点分类和链路预测两个任务上进行了实验,这可能不能完全代表所有图学习任务。第三,作者主要关注LLaMA系列的LLM作为骨干,其他骨干模型(如GPT系列、OPT等)可能表现出不同的sink行为。第四,作者使用固定的阈值tau等于15.0来识别sink token,这个阈值的选择可能影响结果,作者没有进行充分的敏感性分析。最后,作者的分析主要关注激活模式和注意力分布,但没有深入研究这些行为背后的根本原因,例如为什么维度1512会成为一个主导的sink维度,以及为什么sink token主要出现在早期位置。从更广泛的角度来看,本文揭示了当前GLM设计的局限性,但没有提出具体的解决方案或改进建议。

独立分析的弱点

本文的第一个独立分析弱点是研究范围相对有限。虽然作者选择了LLaGA和TEA-GLM作为代表性架构,但它们都是基于LLaMA系列模型的,没有涵盖其他重要的LLM骨干如GPT系列、OPT等。这限制了研究结论的普适性。改进方向是扩展到更多类型的LLM骨干和GLM架构,例如基于GPT的GLM、基于图Transformer的架构等。第二个弱点是实验任务相对单一,仅包括节点分类和链路预测。图学习领域还有很多其他重要任务如图生成、图匹配、图重构等,这些任务可能需要不同的图token表示策略。改进方向是在更多类型的图学习任务上验证本文的发现。第三个弱点是干预实验的设计相对简单。作者只测试了剪枝top-2 sink token、剪枝随机非sink token和交换位置三种干预,没有测试更复杂的干预如逐步增加剪枝数量、使用不同的剪枝策略(如基于激活梯度的剪枝)等。改进方向是设计更全面的干预实验,更精确地量化sink token的贡献。第四个弱点是对sink行为背后的根本原因解释不足。作者观察到维度1512成为主导sink维度,但没有深入分析为什么是这个维度,以及这个维度在预训练LLM中的角色。改进方向是结合预训练LLM的分析,理解sink维度的来源和演化。

未来方向

作者提出的未来工作方向包括研究其他GLM架构是否表现出不同的图sink token行为,以及如何改进图token构建、放置和图文本对齐,使图token更好地在LLM内保留拓扑感知信息。基于本文的成果,可以延伸出多个有潜力的研究方向。首先是设计更好的图token表示方法。本文发现当前GLM的图token没有自然形成可用的拓扑感知内部表示,因此可以探索如何设计更有效的图token,例如学习图结构感知的token位置编码、使用图神经网络生成的注意力引导机制等。其次是研究sink行为的缓解策略。作者发现剪枝sink token影响很小,但移除后LLaGA会重新分布sink行为,这表明sink行为可能是一种深层架构特性,需要设计专门的缓解策略。第三是研究图token和文本token的交互机制。本文发现图sink token主要暴露通用领域级信号,这说明图token和文本token的交互可能不够有效,可以探索如何设计更好的交互机制。第四是研究跨模态的sink行为比较。作者比较了GLM与文本和视觉-语言模型中的sink行为,未来可以系统研究不同模态中sink行为的共性和差异,从而设计更通用的多模态模型。

复现评估

本文的复现评估情况如下。作者使用了两个公开可用的GLM模型:LLaGA使用公开发布的checkpoint,以vicuna-7b-v1.5-16k作为语言模型骨干;TEA-GLM使用在ogbn-Arxiv上训练的引用领域checkpoint。实验使用的三个数据集(Cora、Arxiv、PubMed)都是公开的图学习基准数据集。算力方面,所有实验在两个NVIDIA A100 GPU上运行,这对于大多数研究机构来说是可获得的。实验细节相对充分,作者在附录A.5中提供了详细的实现细节,包括推理超参数(对于LLaGA:do_sample等于False, temperature等于0.0, top_p等于None, num_beams等于1, max_new_tokens等于1024;对于TEA-GLM训练:AdamW优化器,学习率1乘以10的负4次方,余弦学习率调度,预热比率0.03,50个epoch)和模型配置。然而,本文没有提供代码实现,这增加了复现的难度。总体而言,复现难度中等偏高,主要挑战在于需要正确实现sink token检测、注意力分析和干预实验的完整流程。作者使用了固定的随机种子(42)以确保可重现性,这是一个好的实践。