PAMELA:将文生图生成个性化以匹配个体审美偏好 Personalizing Text-to-Image Generation to Individual Taste
构建大规模个性化美学评分数据集与用户条件奖励模型,让文生图生成对齐个体审美
前置知识
扩散模型与文生图
扩散模型通过迭代去噪过程从随机噪声生成图像,文生图(T2I)模型如 Flux 2、Nano Banana、Stable Diffusion 接收文本提示词并生成对应图像。模型在 LAION 等大规模图文对上预训练,能生成高质量、构图复杂的图像,但优化目标是'平均'人类审美。
本文提出的个性化奖励模型需要给文生图生成打分,必须理解 T2I 模型能接受什么样的提示词修改、生成什么质量的图像,否则无法设计有效的提示词优化策略。
奖励模型与人类反馈强化学习
奖励模型(Reward Model)是一个标量打分器,给定图像与提示词输出'人类有多喜欢'的分数,用于通过 RLHF 或 DPO 引导扩散模型提升生成质量。代表模型有 ImageReward、PickScore、HPSv2/v3、Q-Align、DeQA 等。
本文是对奖励模型范式的批判与改进:现有奖励模型学的是聚合后的'好',本文要学用户条件化的个性化分数,必须先理解奖励模型在偏好对齐中扮演的角色。
提示词优化
提示词优化(Prompt Optimization)指在固定生成模型的前提下,用 LLM(如 LLaMA-3.1-8B)反复改写文本提示词,再用奖励模型挑选高分变体,从而在推理时无需微调生成模型即可提升输出质量。Ashutosh 等人的方法是代表性工作。
本文用提示词优化作为'探针',把个性化奖励模型用于实际生成任务。如果只评估打分准确率但无法影响生成,奖励模型的应用价值就大打折扣。
视觉-语言预训练编码器
SigLIP2、SigLIP 等是联合训练图像-文本的 ViT 编码器,能把图像和文本映射到同一向量空间,常作为下游视觉任务的冻结特征提取器。本文用它提取图像与提示词的多模态嵌入。
本文的预测器核心是把 SigLIP2 提取的图像-文本 token、用户人口学 token、用户偏好 token 拼起来送入 Transformer,必须先理解这种 token 序列化的范式。
SROCC、PLCC 与成对准确率
Spearman 等级相关系数(SROCC)衡量预测分数与真实分数的秩序一致性,Pearson 线性相关系数(PLCC)衡量线性相关性,成对准确率(pairwise accuracy)衡量模型能否在两张图之间正确判断哪张更受用户喜欢。
本文报告的 User 级与 Avg 级 SROCC/PLCC/成对准确率是评估个性化奖励模型的标准指标,决定能否正确对图像排序。
研究动机
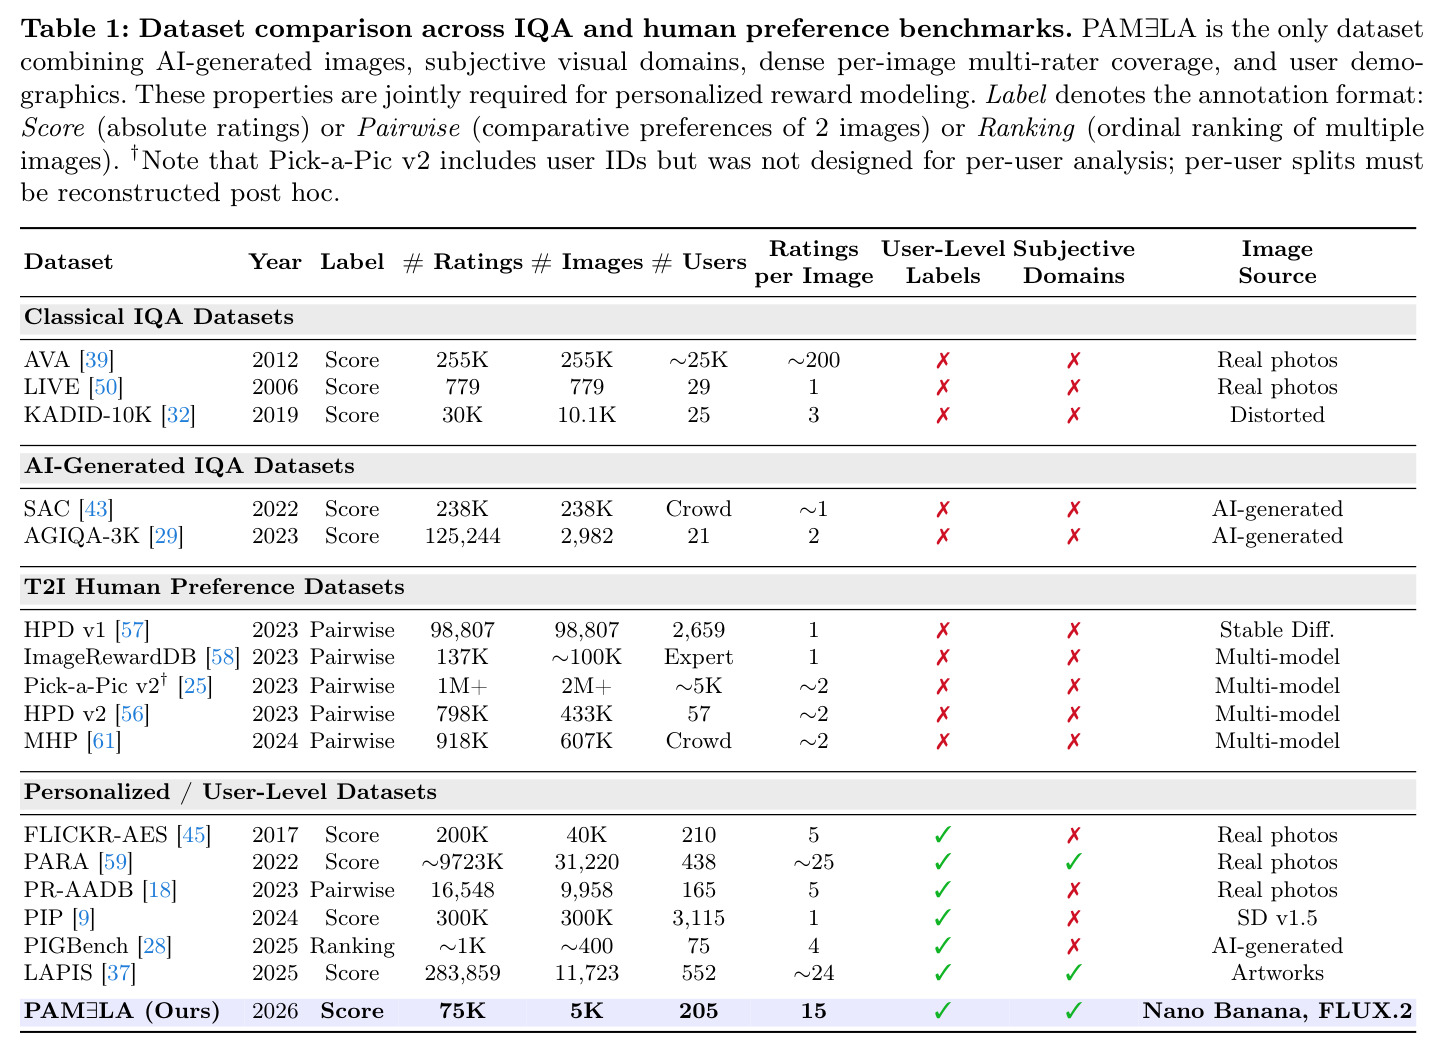
现代文生图模型(Flux 2、Nano Banana)虽能生成高保真图像,但训练目标本质是群体平均偏好,完全忽略个体差异。ImageReward、HPSv3、Q-Align 等奖励模型在 Pick-a-Pic、HPD v2 等 10 万-100 万条 pairwise 数据上训练后学会的是聚合后的"好看",但同一提示词下不同用户期待可能截然不同(如极简 vs 赛博朋克浓饱和度)。更严重的是这些奖励模型常用陈旧 AI 图训练,随着 T2I 模型快速迭代,反而会引导生成器走回过时的生成伪影(older generative artifacts)。另一类"个性化"方法(DreamBooth、Textual Inversion)只个性化图像内容(特定宠物、人脸),不解决对同一张图不同用户给不同分的主观性问题。已有小规模个性化数据集 PIGBench 仅 400 张图 75 用户,PARA、LAPIS 覆盖真实照片或艺术作品,不含 AI 生成图像这一全新视觉域。
本文的目标是本文要构建第一个真正面向 AI 生成图像的、规模足够大的个性化美学评估基准 PAMELA(Personalized Aesthetic Model & Large-scale Appraisals),并基于此训练一个用户条件化的奖励模型,能预测特定用户对 (提示词, 图像) 对的评分;最终通过提示词优化把这种个性化分数转化为面向个体用户的图像生成。具体目标包括:(1)收集 70,000+ 条评分,覆盖 5,000+ 张 AI 生成图像和 200+ 用户,每张图至少 15 个用户打分;(2)训练 PAMELA predictor,使其在用户级和群体级指标上都超过现有 SOTA 奖励模型;(3)通过用户研究证明个性化优化的图像真的被用户偏好,且这种偏好在统计上显著。
与已有工作不同的是,本文的独特切入角度是同时解决三个被现有工作割裂的问题:(a)'AI 生成的图像'这一全新视觉域尚未被任何个性化美学数据集覆盖;(b)已有数据集每张图的评分者数量(1-4 人)太少,无法支持稳定的 per-user 预测,PAMELA 强制 15 人覆盖;(c)已有奖励模型只学群体均值,PAMELA 通过把人口学 embedding、可学习用户 embedding、图像-提示词 token 拼接到同一 Transformer 来显式建模用户条件。配合对未见用户的 K 近邻用户嵌入插值机制,实现了无需重新训练就能扩展到新用户的少样本个性化(k∈[15,25])。这是第一次把'AI 图 + 多评分者 + 用户人口学 + 少样本迁移'四要素在同一基准中合在一起。
核心方法
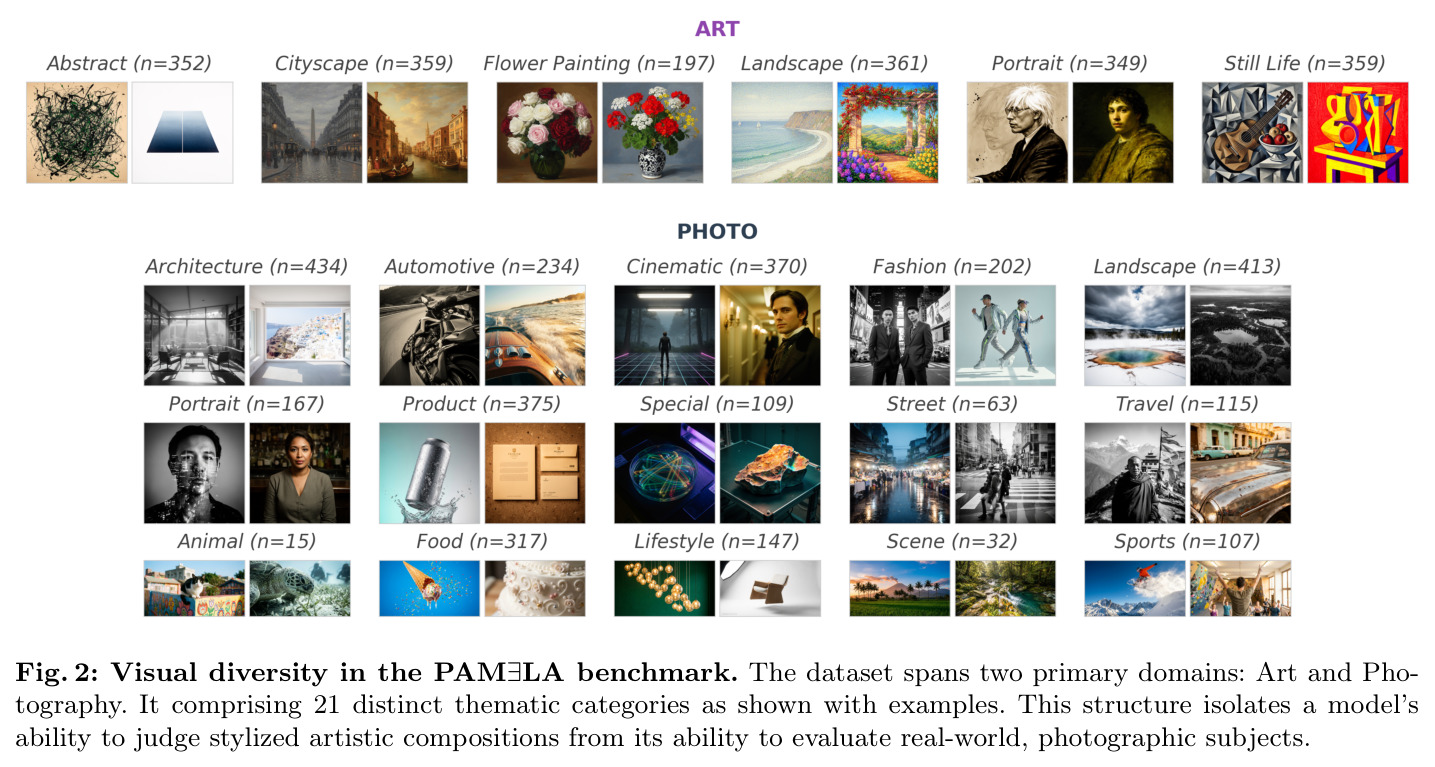
PAMELA 整体思路分两阶段:先用 Flux 2 和 Nano Banana 生成 5,077 张覆盖艺术与摄影两个域、21 个主题的图像;然后在 Mabyduck 平台让 200+ 真实用户用 5 点滑杆(bad/poor/fair/good/excellent)对每张图打分,同时收集年龄、性别、国籍等人口学元数据,得到 (提示词 p, 图像 img, 用户 u, 评分 r) 四元组作训练信号。模型采用"冻结大编码器 + 浅层融合 Transformer + 线性回归头"范式:图像与提示词由冻结 SigLIP2 编码为 token,人口学和图像元数据(流派、风格、情感、语义内容)由冻结 llama-embed-nemotron-8B 编码为文本描述再过 MLP 投影,每个训练用户学一个独立可训练 embedding,所有 token 拼成序列加 [CLS] 过浅层 Transformer,用 [CLS] 输出做 MSE 损失回归评分。核心创新是把"用户身份"与"用户人口学"同时作为可学习/可条件输入,使一个模型在不同用户下输出不同分数。
PAMELA 与已有奖励模型本质区别:后者无论 query 是谁输出都是单一标量;PAMELA 是条件化的——给定 (图像, 提示词, 用户元数据, 用户 embedding) 输出该用户专属评分。核心创新三点:(1) 把用户人口学作为冻结 LLM 编码的文本(不是 one-hot)注入;(2) 对见过用户用 learned user embedding 表,对未见用户用 K 近邻插值 $\hat{\mathbf{e}}_u = \sum_{n=1}^{K} w_n \mathbf{e}_{u_n}$,$w_n = \frac{\exp(\hat{\mathbf{p}}_u \cdot \mathbf{p}_{u_n}/\tau)}{\sum_{j=1}^{K}\exp(\hat{\mathbf{p}}_u \cdot \mathbf{p}_{u_j}/\tau)}$,$\hat{\mathbf{p}}_u$ 是未见用户用 k 张上下文按评分加权平均的 profile 向量,实现少样本迁移;(3) 联合训练在 PAMELA + LAPIS + PARA 三个数据集。
方法步骤详情
方法分七步:(1) Flux 2 + Nano Banana 按 21 主题生成 5,077 张图;(2) Mabyduck 5 锚点滑杆打分 + 收人口学;(3) 划训练 / seen / unseen 三集;(4) 前向:图+提示词过冻结 SigLIP2,人口学+元数据过冻结 Nemotron-8B+MLP;用户 embedding 取自 learned table;与 [CLS] 拼起过浅层 Transformer 预测评分;(5) 训练 AdamW、lr $2 \times 10^{-5}$、batch 32、10 epoch、MSE,联合 PAMELA+LAPIS+PARA;(6) 未见用户用 k∈[15,25] 张上下文按评分加权算 profile $\hat{\mathbf{p}}_u$,温度 softmax 插值得 $\hat{\mathbf{e}}_u$ 替代 learned embedding;(7) 引导用 LLaMA-3.1-8B-Instruct 每轮 T=20 变体,Flux 2-dev 渲染,PAMELA 打分保留 top-1,最多 5 轮早停。
技术新颖性
技术新颖性体现在三个层面。第一层面是数据集层面:把'AI 生成的图'、'多评分者密集覆盖(15/图)'、'用户人口学'、'主观性视觉域'四个属性首次合在一起,填补了 PIGBench(缺 AI 图)、PIP(缺多评分者)、PARA/LAPIS(缺 AI 图)共同留下的空白。第二层面是模型架构层面:把'用户人口学'、'用户偏好 embedding'、'图像-提示词 token'、'图像元数据 token'统一序列化到同一 Transformer,区别于 PIAA 领域用图神经网络或交互矩阵的传统做法([22,51,64]),从而借助大预训练编码器获得强泛化能力。第三层面是少样本迁移层面:用 K 近邻在 profile 空间插值用户 embedding 而非微调模型,这种'近邻插值 + 温度 softmax'机制允许模型零样本扩展到新用户,且不增加推理时的参数,是相对优雅的工程方案。
![Architecture of our personalized aesthetic quality predictor. Visual and semantic features are extracted by a frozen SigLIP2 encoder; user demographic and image metadata embeddings are produced by a frozen embedding encoder. All features are projected to a shared dimension, assembled as a token sequence with a learnable [CLS] token, and fused by a shallow transformer encoder.](/papers/2604.07427/images/figure_3.jpg)
实验结果
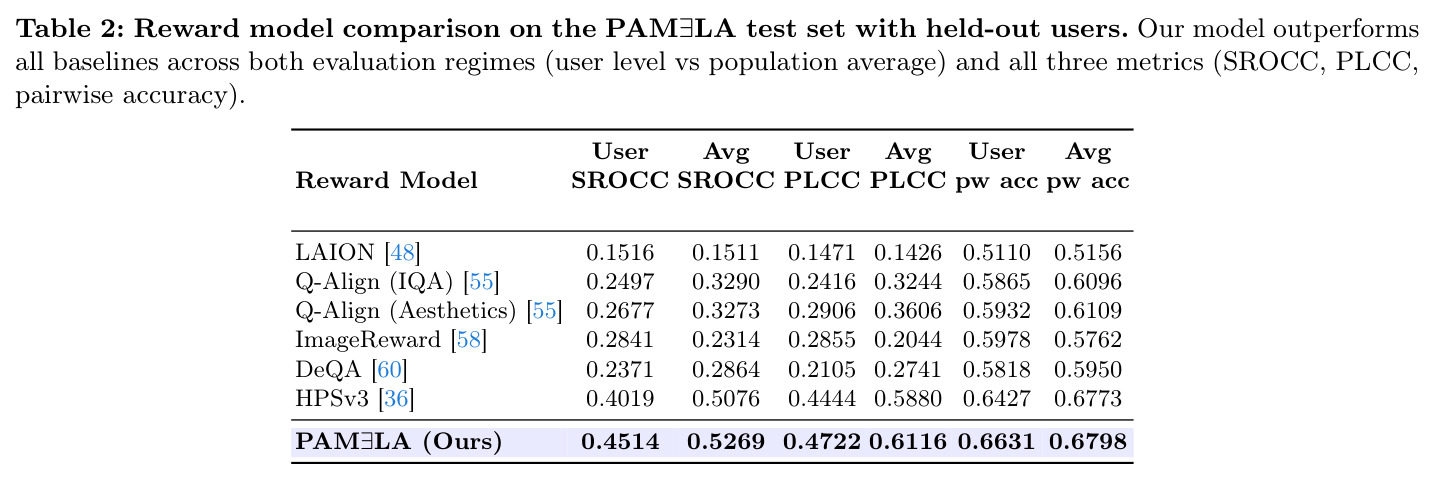
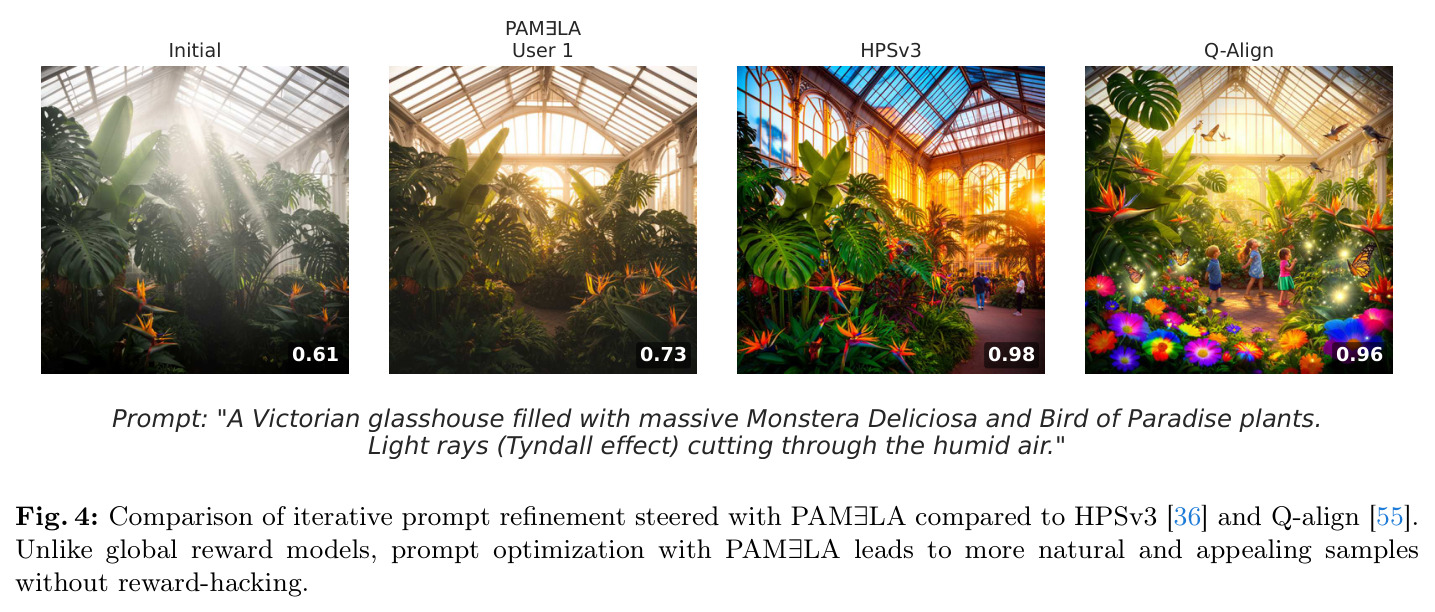
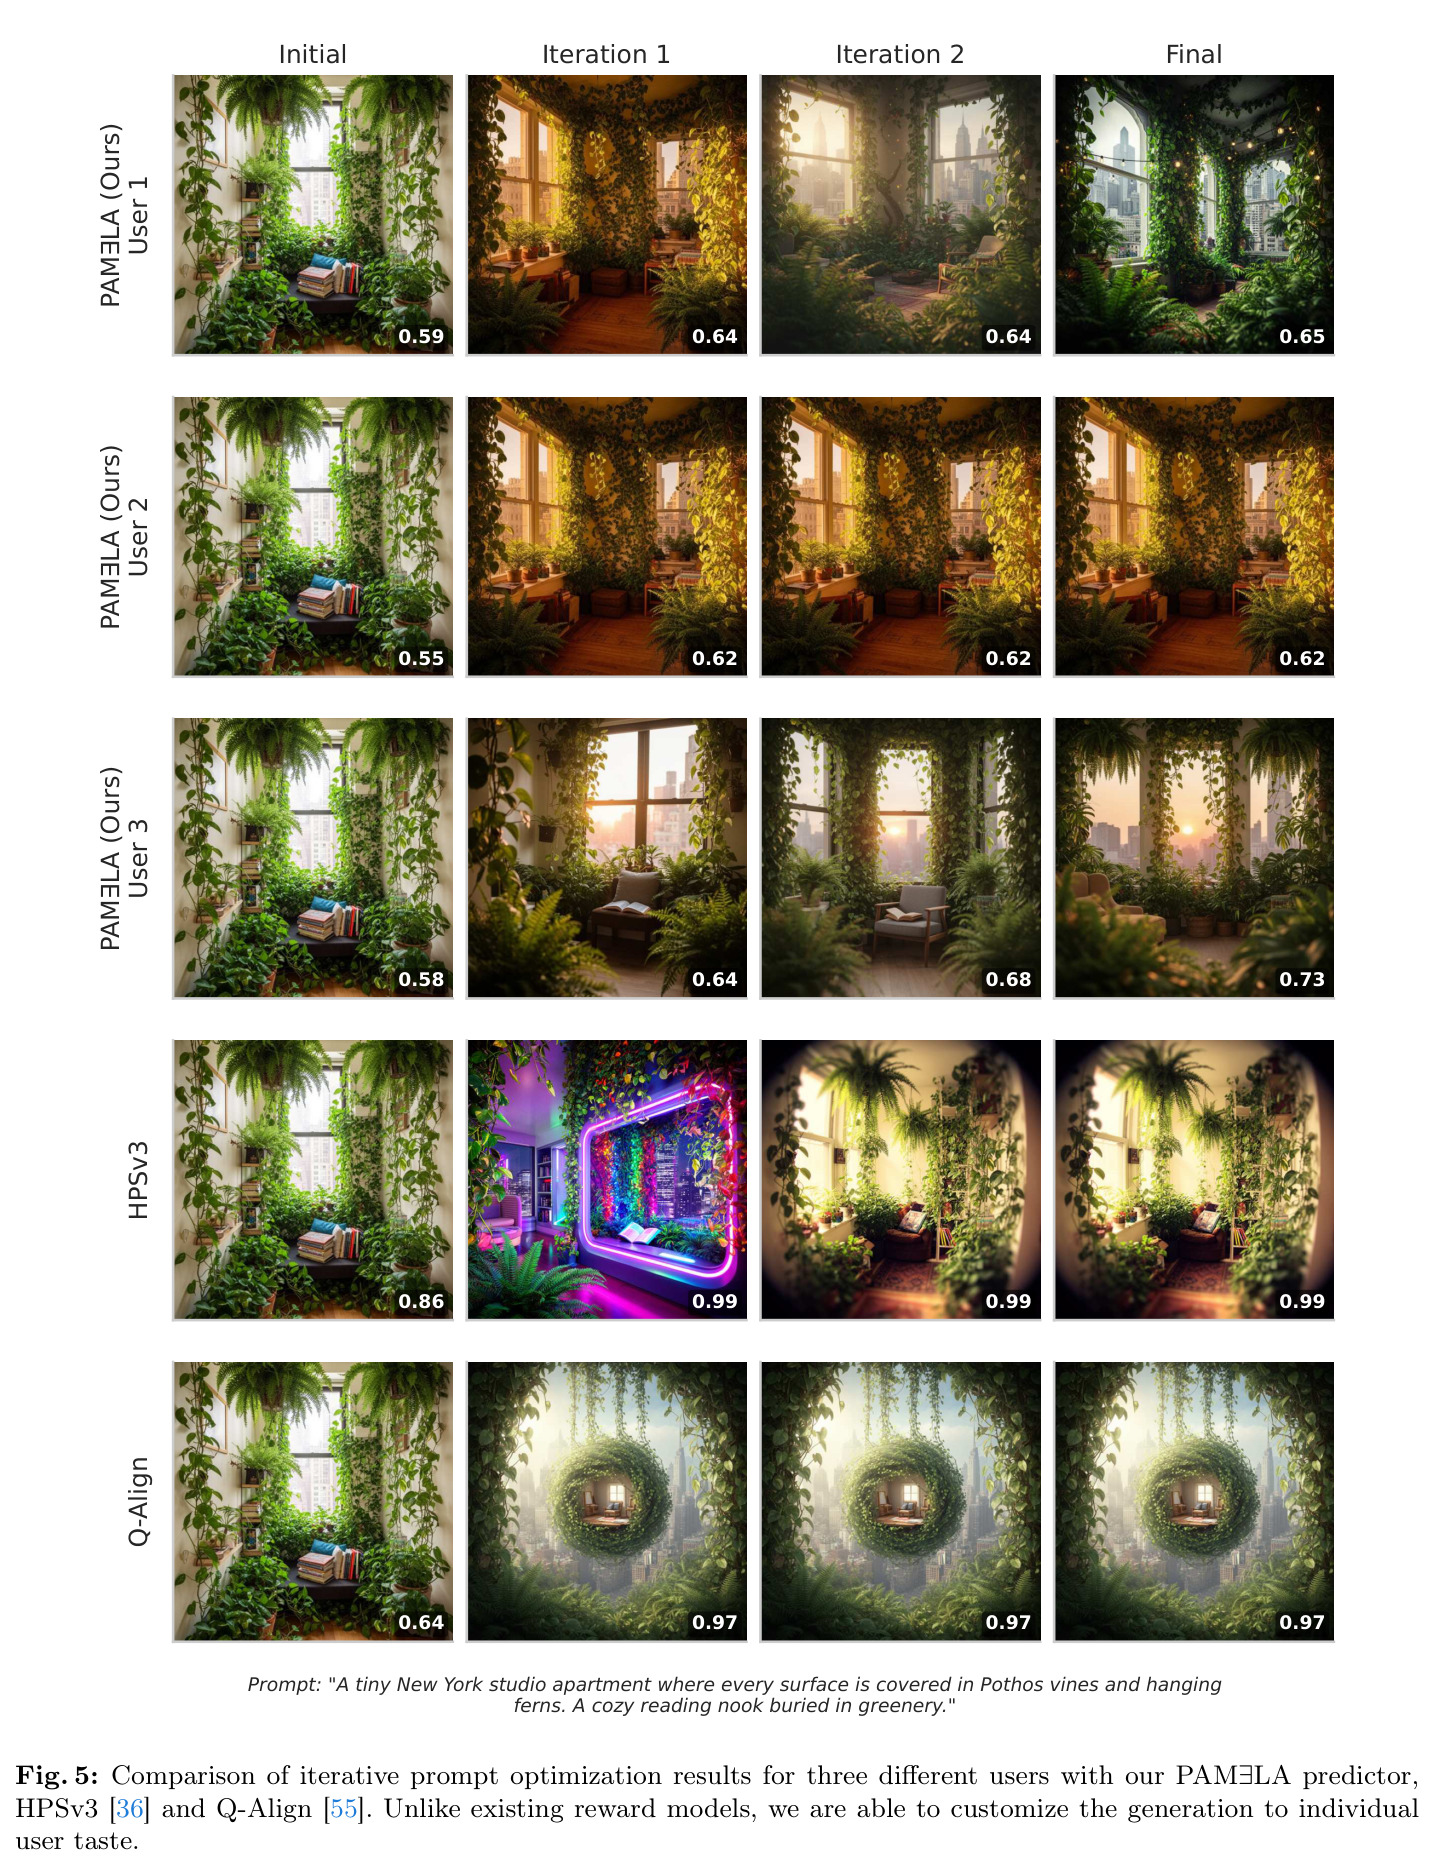
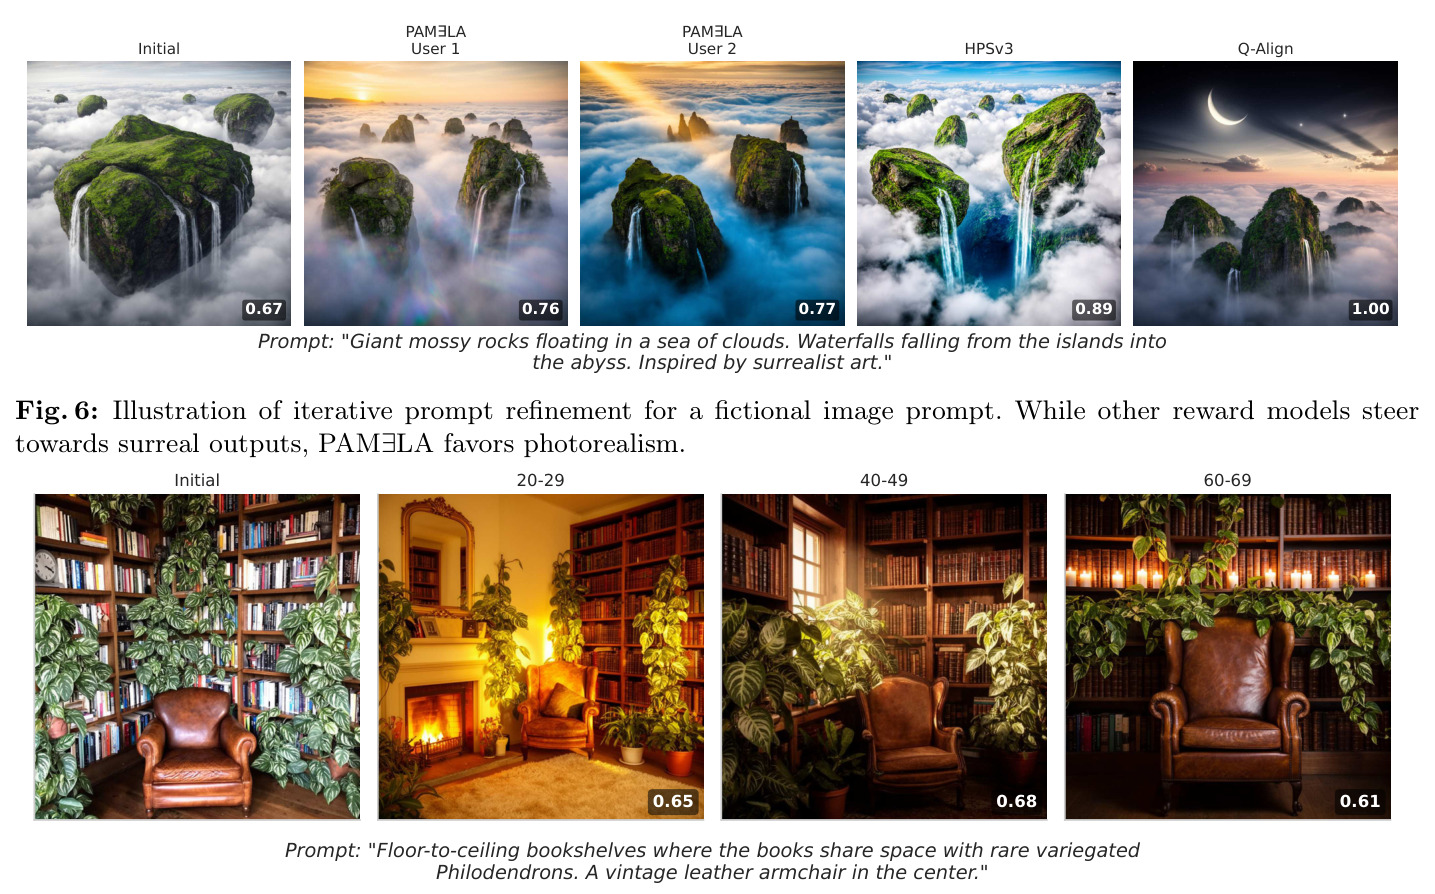
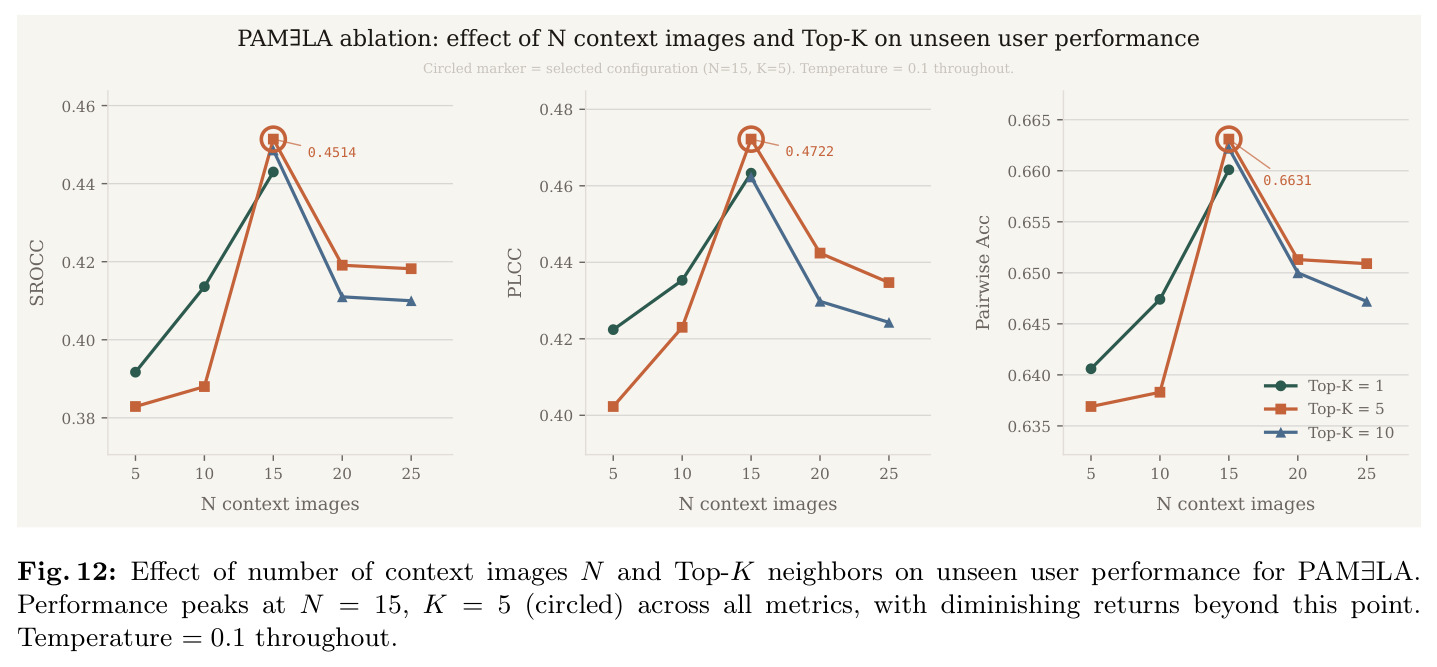
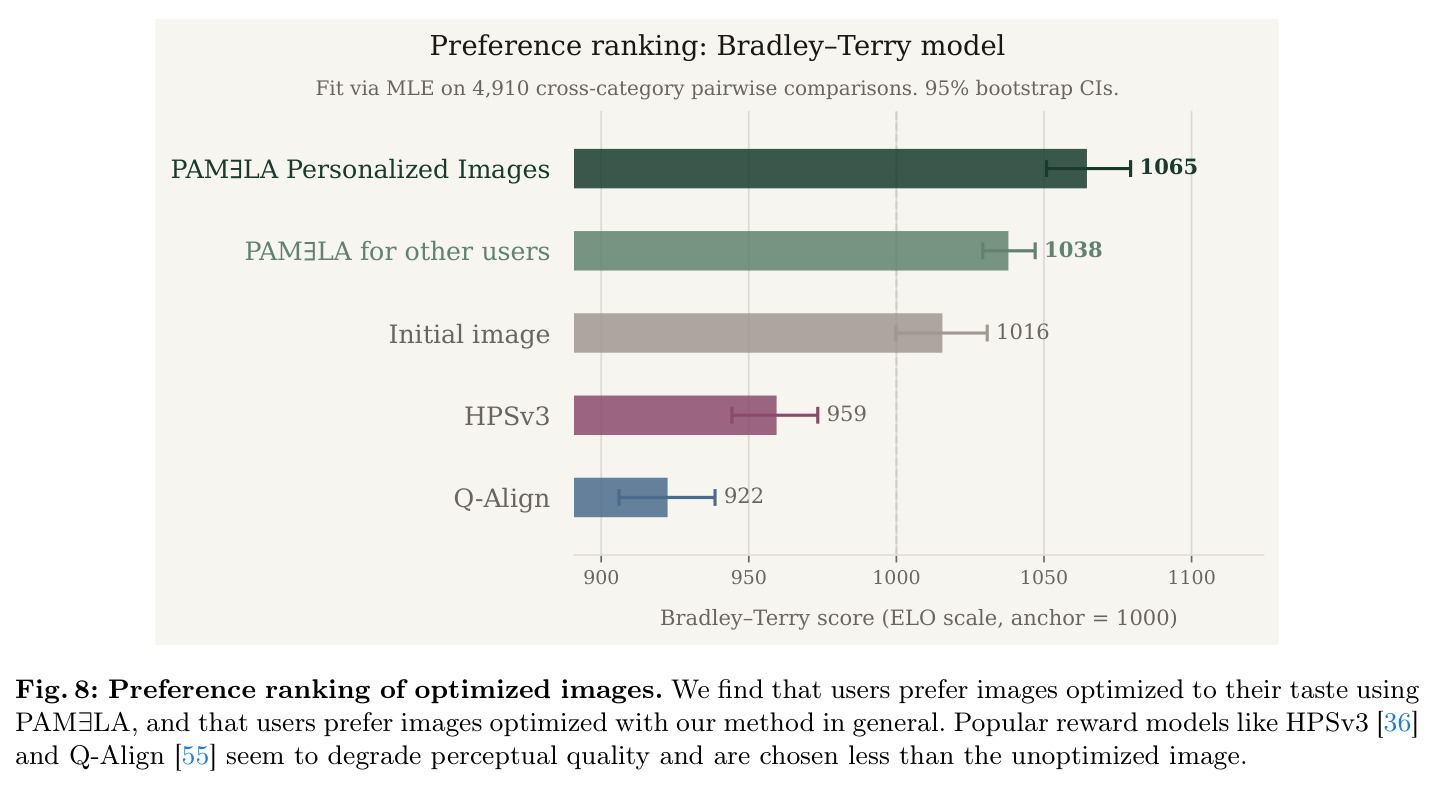
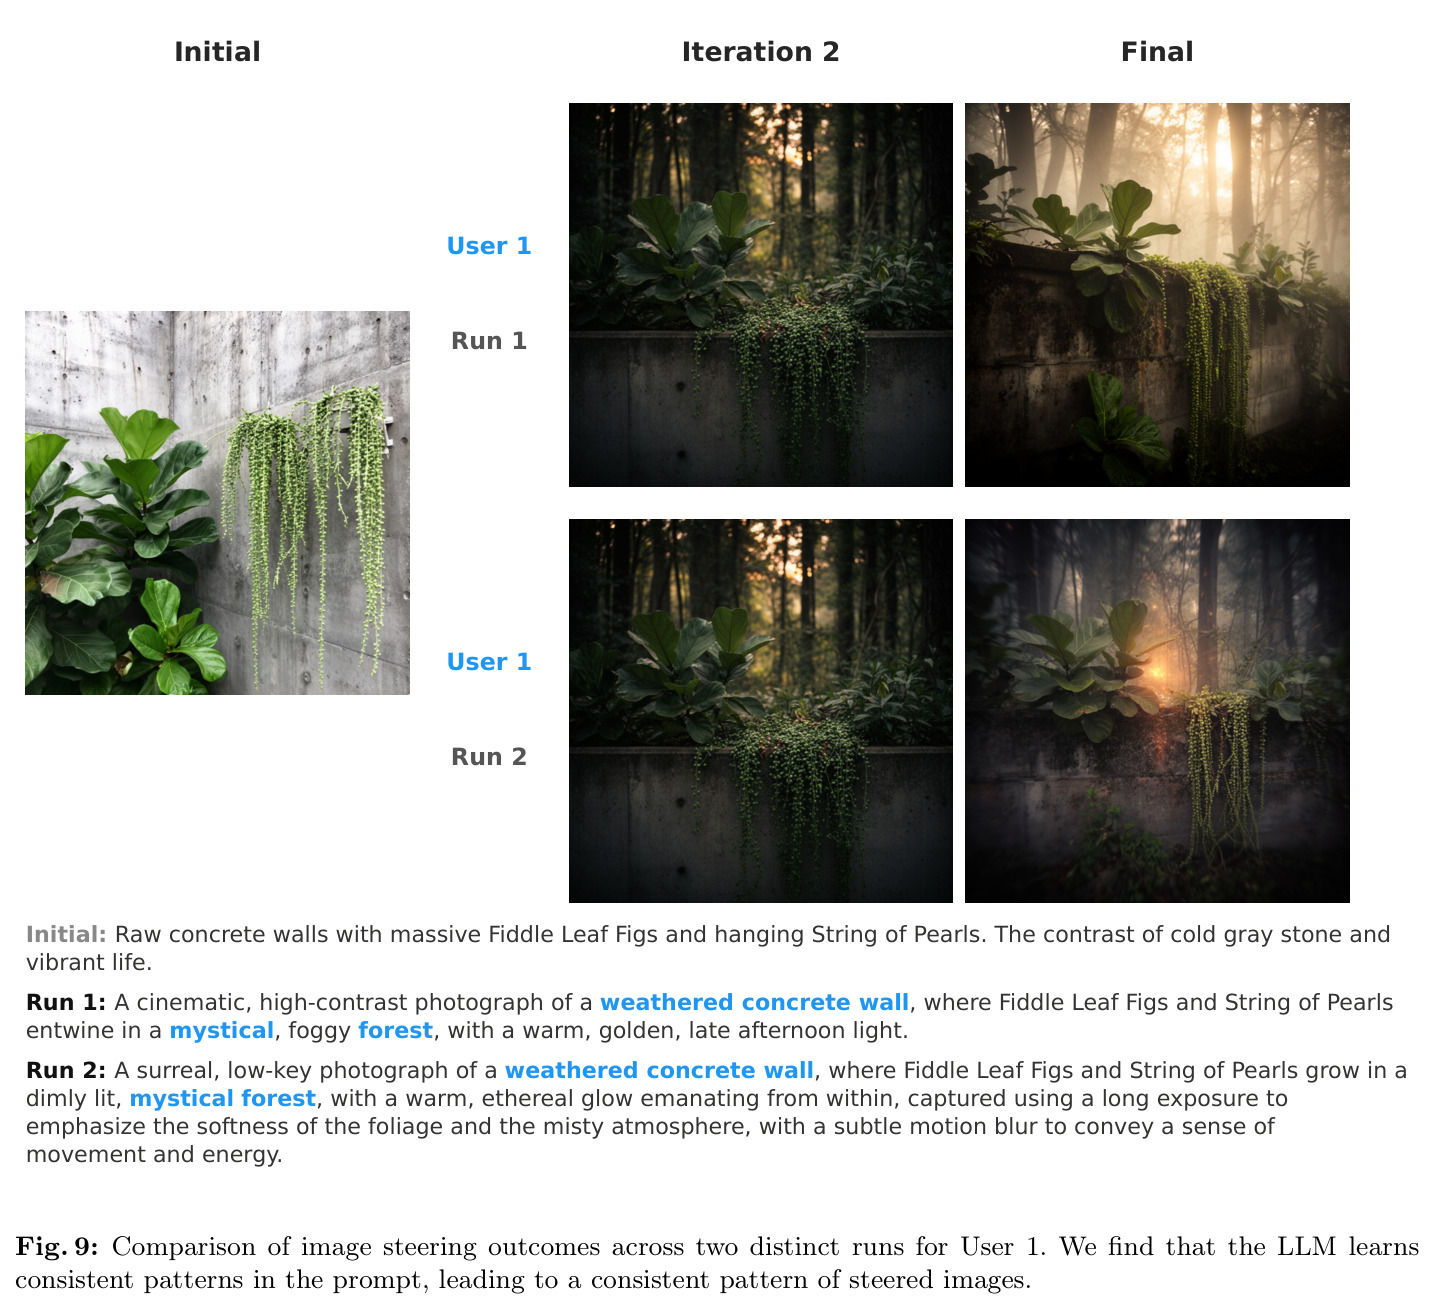
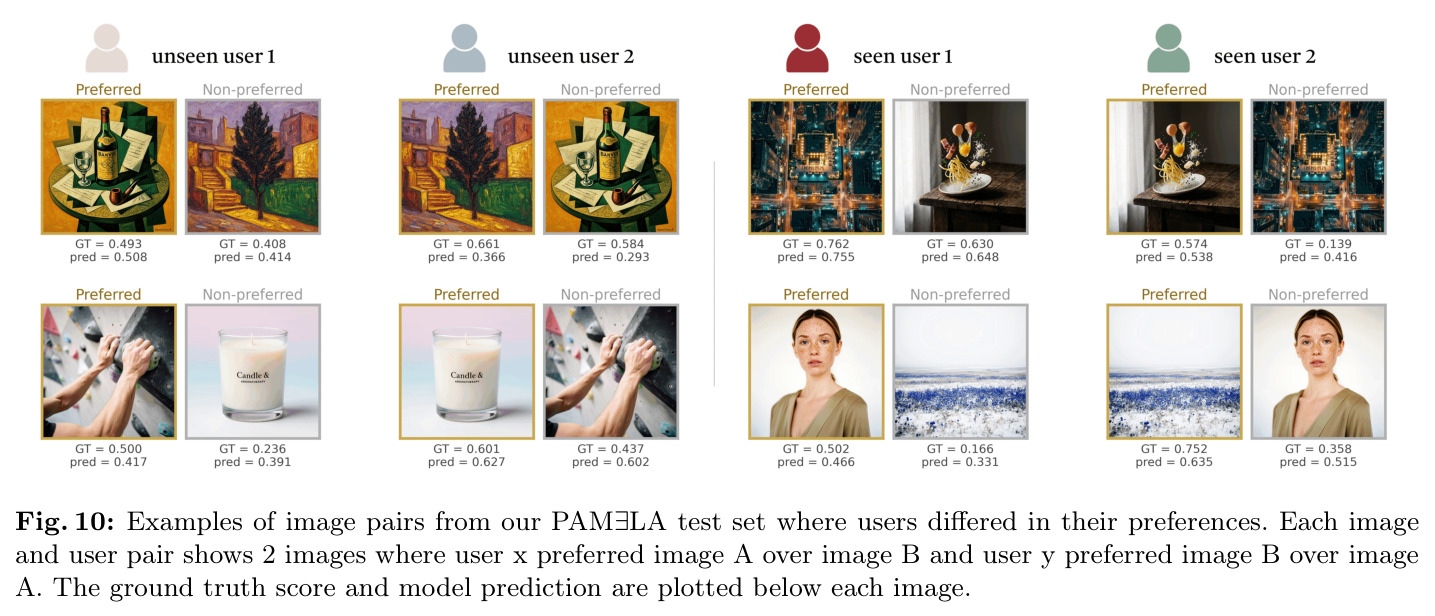
Table 2 显示 PAMELA 在 6 个指标 SOTA:User SROCC 0.4514(vs HPSv3 0.4019、ImageReward 0.2841)、User PLCC 0.4722、User 成对准确率 0.6631,群体均值 SROCC 0.5269、PLCC 0.6116、成对准确率 0.6798,最大增益在 User 维度(比 HPSv3 SROCC 高 12.4%)。Figure 8 Bradley-Terry 显示 PAMELA 个性化得分 1065、其他用户 1038、初始 1016,HPSv3 959、Q-Align 922,CI 不重叠,通用模型引导反而减分。Figure 4-7 展示 HPSv3/Q-Align 把图推向"AI 味",PAMELA 改调节构图。Figure 7 显示 20-29 岁组饱和度更高、60-69 岁更柔和,揭示通用奖励模型的人口学偏见。Figure 9 双种子实验显示优化方向高度收敛。Section 7.1 偏好冲突中 PAMELA 在 seen 61.44%、unseen 55.23%(vs 随机 50%)。
查看结构化数据
| 任务 | 指标 | 本文 | 基线 | 提升 |
|---|---|---|---|---|
| 个性化美学评分预测(seen/unseen 用户) | User SROCC | 0.4514 | HPSv3: 0.4019;ImageReward: 0.2841;Q-Align (Aesthetics): 0.2677 | 比最强基线 HPSv3 提升约 0.05(+12.4% 相对) |
| 个性化美学评分预测(seen/unseen 用户) | User PLCC | 0.4722 | HPSv3: 0.4444;Q-Align (Aesthetics): 0.2906;ImageReward: 0.2855 | 比 HPSv3 提升 0.0278(+6.3% 相对) |
| 个性化美学评分预测(seen/unseen 用户) | User 成对准确率 | 0.6631 | HPSv3: 0.6427;Q-Align (Aesthetics): 0.5932;ImageReward: 0.5978 | 比 HPSv3 提升 0.0204(+3.2% 相对) |
| 群体均值美学评分预测 | Avg PLCC | 0.6116 | HPSv3: 0.5880;Q-Align (Aesthetics): 0.3606;DeQA: 0.2741 | 比 HPSv3 提升 0.0236(+4.0% 相对) |
| 群体均值美学评分预测 | Avg 成对准确率 | 0.6798 | HPSv3: 0.6773;Q-Align (Aesthetics): 0.6109 | 比 HPSv3 提升 0.0025(+0.4% 相对,几乎持平但仍最优) |
| 用户研究(Bradley-Terry Elo 分数) | 偏好得分(Elo scale) | 1065(personalized) | 未优化初始: 1016;HPSv3: 959;Q-Align: 922 | 比初始高 49 分,比 HPSv3 高 106 分,CI 不重叠 |
| 偏好冲突对预测 | 成对准确率 | 0.6144(seen)/ 0.5523(unseen) | 随机猜测: 0.50 | seen 用户绝对提升 +11.4%,unseen 用户绝对提升 +5.2% |
局限与改进
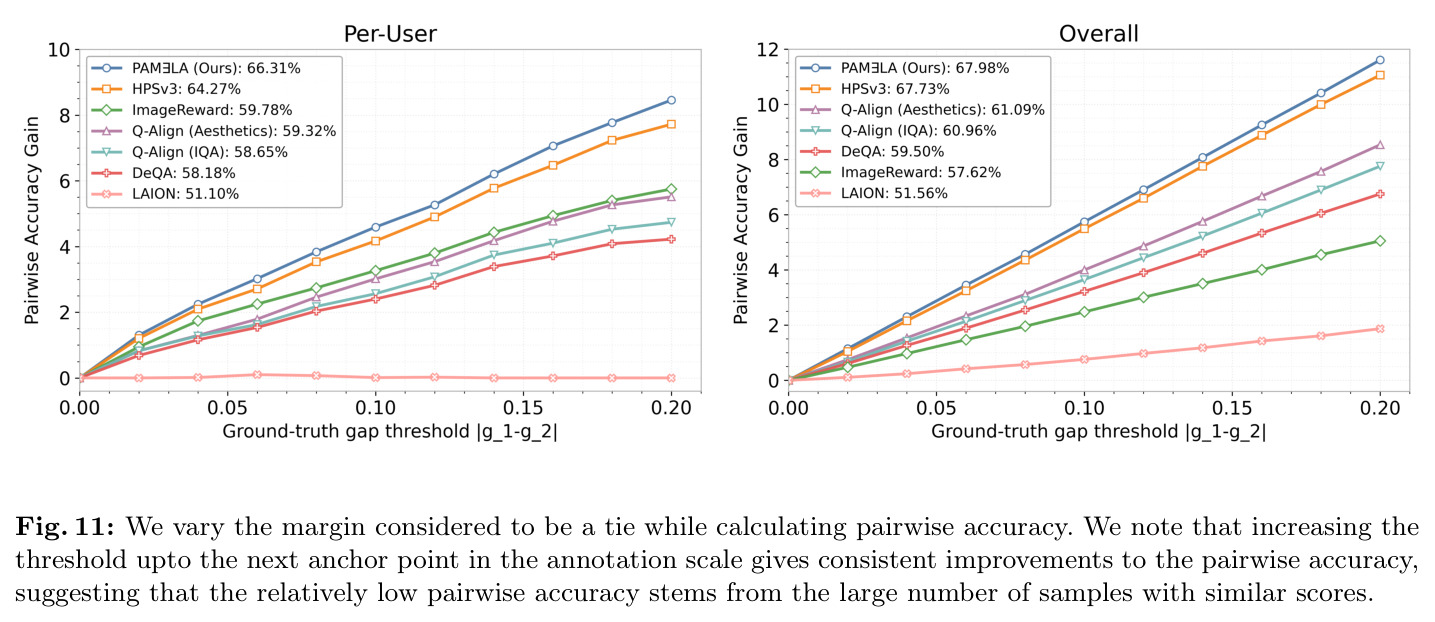
作者在 Section 8 明示的局限有:第一,用户强分歧时预测仍困难,unseen 用户冲突对准确率仅 55.23%,距实用较远;第二,连续评分尺度引入大量近 ties 噪声,强行比较过度惩罚模型,Figure 11 显示这些 ties 贡献相当一部分"错误"。读者视角的补充:第三,5,077 张图对个性化研究虽已是进步,但相比 ImageRewardDB(~10 万图)规模仍小,可能限制对罕见视觉风格的覆盖;第四,K=15-25 上下文需求对真实部署不友好;第五,Table 2 中"个人"与"群体"指标差距不大(User SROCC 0.4514 vs Avg SROCC 0.5269),说明用户间一致信号可能比个性化信号更强;第六,Bradley-Terry 用户研究只有 4,910 pairwise、6 用户,统计功效有限;第七,提示词优化最多 5 轮,没有与 DPO/RLHF 微调生成器对比;第八,"联合训练"带来的增益到底来自 PAMELA 还是 LAPIS/PARA 难以拆解。
独立分析的弱点
独立分析的弱点与改进方向如下。其一,unseen 用户迁移最薄弱:K 近邻插值假设"相似偏好的用户分布在嵌入空间局部",但用户视觉偏好可能正交(都爱极简 vs 都爱繁复装饰),全局余弦相似度检索可能失效;改进方向是引入条件密度估计或对抗式用户表征。其二,提示词优化阶段依赖 LLaMA-3.1-8B-Instruct 的改写能力,LLM 本身也有"AI 味"可能限制优化天花板;改进方向是同时微调生成器(如 FLUX-LoRA)释放更多表达空间。其三,每位用户标注数差异较大(平均 365 张),尾部用户数据稀疏。其四,Bradley-Terry 研究样本量过小(4,910 比较、6 用户),CI 估计不稳定;改进方向是扩大用户数到 30+ 并增加比较次数。其五,"人口学条件化"只是平均聚合,可能制造新刻板印象;改进方向是引入因果解耦。其六,模型只支持 1-5 分绝对评分,未与 pairwise 偏好联合训练,可能损失排序信号。
未来方向
作者在 Section 8 与 6.1 提到的未来方向包括:解决连续评分的近 ties 噪声(用 Plackett-Luce 等模型替代 MSE)、扩展到更极端的零样本个性化(不需 k 张上下文)、结合 DPO 等偏好微调方法直接调整生成器。从论文成果还可延伸:第一,把 PAMELA predictor 嵌入到 RLHF/DPO 流程,做 T2I 模型的全参数个性化微调(不再仅提示词优化);第二,把'用户'概念推广到更细粒度(如同一用户在不同时刻的情绪差异),做时序个性化;第三,结合视频 T2I 模型(Sora、Veo)扩展 PAMELA 到视频美学评估;第四,用多模态大模型(GPT-4o、Gemini)作为'虚拟用户'替代部分人工标注,缓解长尾稀疏;第五,跨文化对比研究:当前用户主体是欧洲,可扩充到亚洲、非洲、南美用户,验证'高饱和度偏好'等结论是否具有文化普遍性;第六,把个性化奖励模型作为评测工具反向诊断现有偏好数据集的隐性人口学偏差。
复现评估
复现性整体良好。论文明示了数据来源(Flux 2、Nano Banana)、平台(Mabyduck)、规模(5,077 图、~70,000 评分、200+ 用户)、训练超参(AdamW、lr $2 \times 10^{-5}$、batch 32、10 epoch、warmup 100 步)、生成超参(FLUX.2-dev、50 步、guidance 4.0、512×512)、提示词优化超参(T=20、最多 5 轮)、LLM(LLaMA-3.1-8B-Instruct)、冻结编码器(SigLIP2、llama-embed-nemotron-8B)。作者承诺 release 数据集与模型,Tübingen AI Center + KU Leuven 联合背书。算力:PAMELA predictor 是浅层 Transformer + 冻结 SigLIP2,单卡 A100/H100 可训练;提示词优化每张图需 100 次 FLUX.2-dev 推理,是主要算力消耗点。复现难度:训练中等,提示词优化较低,但完整复现用户研究需重新招募 6 名用户最具挑战。
论文图表
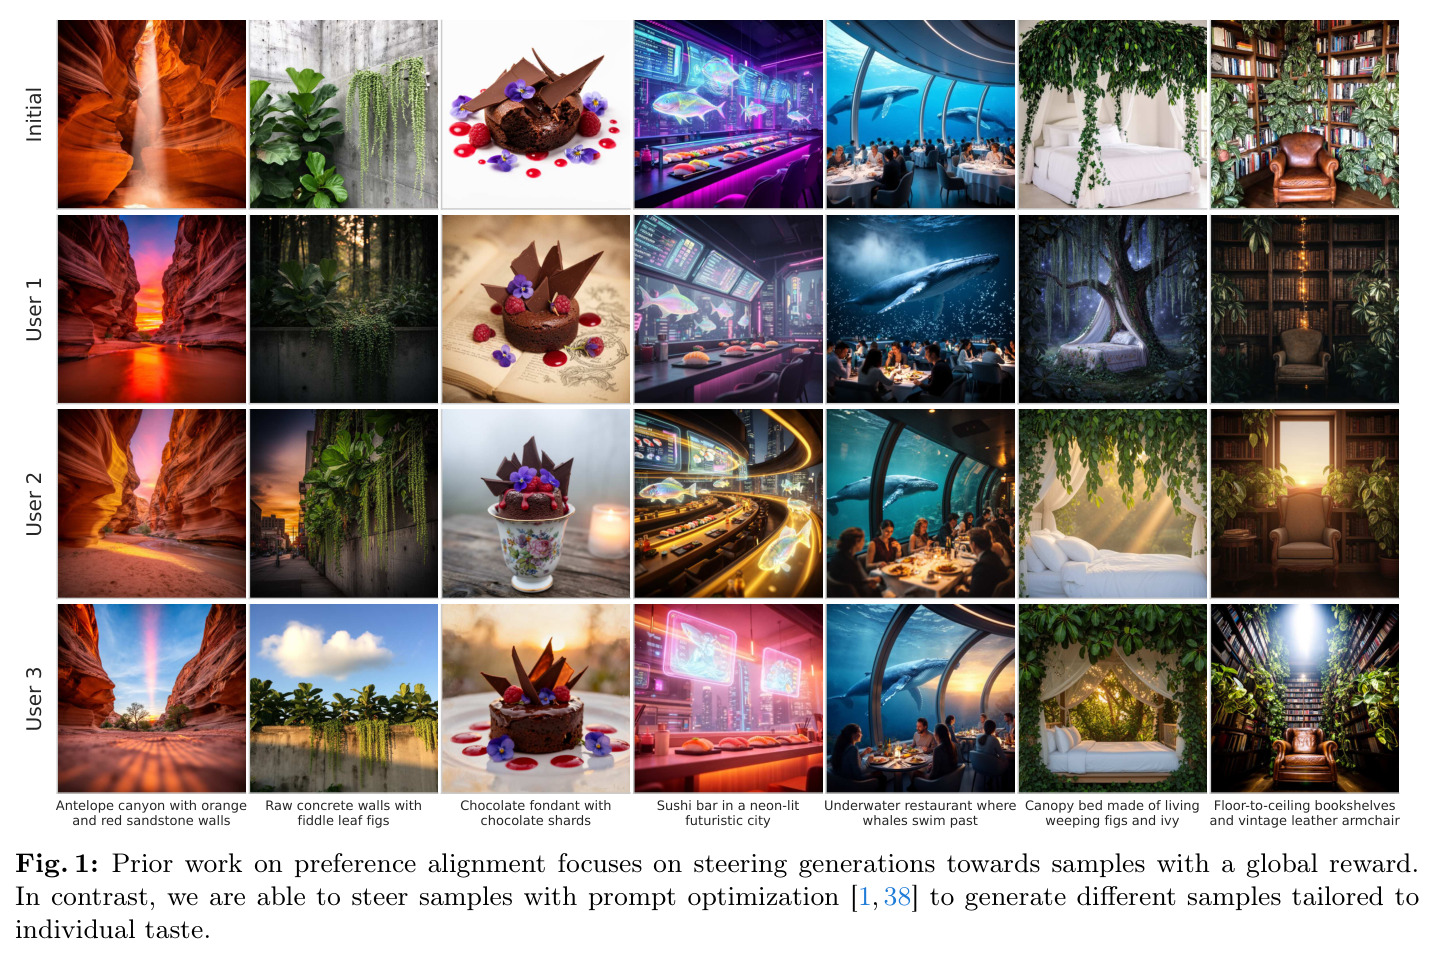
顶部展示 6 张由 Flux 2 生成的图,标题 'Personalizing Text-to-Image Generation to Individual Taste';下方 7 列对比表显示同一提示词下 Initial、User 1、User 2、User 3 四种输出的视觉差异。
这是论文的封面图,直接展示'个性化'这一核心卖点——同一提示词不同用户得到截然不同的输出。读者一图就能理解本文的差异化贡献。